Testing Random-Number Generators
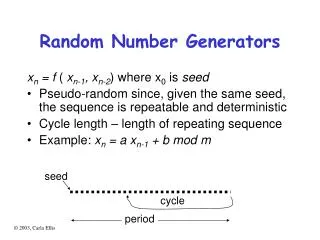
Testing Random-Number Generators. Andy Wang CIS 5930-03 Computer Systems Performance Analysis. Testing Random-Number Generators. How do you know if your random number streams are good? Plot histogram, CDF, QQ-plot Run tests Necessary but not sufficient to prove the quality of a generator


Testing Random-Number Generators
E N D
Presentation Transcript
Testing Random-Number Generators Andy Wang CIS 5930-03 Computer Systems Performance Analysis
Testing Random-Number Generators • How do you know if your random number streams are good? • Plot histogram, CDF, QQ-plot • Run tests • Necessary but not sufficient to prove the quality of a generator • If it fails a test, the generator is bad • Passing a test is not a guarantee that a generator is good • Tests can also be used to verify distribution matching
Chi-Square Test • Most commonly used test • Tests if a data set matches a distribution • Steps • Prepare a histogram with k bins • Compare the observed and expected frequencies via a formula • If the computed value < 2[1-α; k-1] (Table A.5) • We have a match
Chi-Square Example • N = 1000 • k = 10 • 2[1-0.1; 10-1] = 14.68 • A match
Fine Prints • For nonuniform distributions • Watch out for small expected values, which can affect the outcome • Remedy • Use variable bin sizes, so that the expected outcomes are equal • Designed for discrete distribution with large sample sizes
Kolmogorov-Smirnov Test • Tests if a sample of n observations is from a continuous distribution • Observation • If two distributions match, • | observed CDF Fo(x) - expected CDF Fe(x) | should be small
K-S Test • Differences are measured by the maximum observed deviations above and below the expected CDF K+ = n maxx[Fo(xi) - Fe(xi)] K- = n maxx[Fe(xi + 1) - Fo(xi)] • If both K+ and K- < K[1-α; n] (Table A.9) • We have a match
K-S Example • xn = 3xn-1 % 31 n = 30 x0 = 15 • K[0.9, 30] = 1.042 • A match
K-S Test vs. Chi-square Test • K-S test • Designed for small samples and continuous distributions • Uses differences between CDFs • Similar to QQ-plots • Tests each sample without grouping • Exact • Chi-square test • Designed for large samples and discrete distributions • Uses differences between pdfs/pmfs • Requires grouping • Approximate
Serial-Correlation Test • Covariance: tests dependence of two random variables • If the covariance is nonzero, variables are dependent • If the covariance is zero, variables can still be dependent
Autocovariance • Autocovariance at lagk (>1) Rk: covariance between numbers that are k values apart, 0 < random number U< 1 • For large n • Rk is normally distributed, with a mean of 0 • Variance of 1/[144(n – k)]
Autocovariance • Confidence interval • If confidence interval does not include zero, the sequence has a significant correlation • Example from slide 8 • xn = 3xn-1 % 31 • x0 = 15 • Not so good
Autocovariance • Another example xn = 75xn-1 % (231 – 1) x0 = 1 • A better random-number generator
Two-Level Tests • If the sample test is too small, test results only apply locally • If the sample test is large, test results only apply globally
Two-Level Tests • Solution • Apply a chi-square test on n bins of size k • Then apply a chi-square test on a set of n-bin statistics • Can locate a nonrandom segment of a random sequence
k-Dimensional Uniformity or k-Distributivity • So far, tests ensure that numbers are uniformly distributed in one dimension For 0 < a < u < b < 1 P(a < un < b) = b – a • It is known as the 1-distributivity of un • For 2-distributivity P(a1< un-1 < b1 and a2< un < b2) = (b1 – a1)(b2 – a2)
Visual Check • Plot successive overlapping pairs of numbers in a 2-D space • E.g., (u0, u1), (u1, u2), … • Example of 15-bit random numbers: • Tausworthe generator • x15 + x + 1 • Period: 215 - 1 • bn+15 bn+1bn = 0 • bn = bn-14bn-15
Visual Check • Another example of 15-bit random numbers: • Tausworthe generator • x15 + x4 + 1 • bn+15 bn+4bn = 0 • bn = bn-11bn-15
Serial Test • Test for uniformity > 2D • Plot nonoverlapping pairs • E.g., (u0, u1), (u2, u3), … • For 2D, divide the space into K2 cells • Each cell is expected to have n/2K2 points • Use the chi-square test • With K2 – 1 degrees of freedom • Can generalize it into k-dimension • Dependency likely to fail high-dimension chi-square tests
Serial Test vs. Visual Check • Serial Test • Uses nonoverlapping points • Assumed by the chi-square test • Has n/2 pairs • Visual Check • Uses overlapping points • Has n – 1 pairs
Spectral Test • Plot successive overlapping pairs of numbers • K-dimension tuples from an LCG fall on a finite number of parallel hyperplanes
Spectral Test Example • xn = 3xn-1 % 31 • Can see three lines with positive slopes • xn = 3xn-1 • xn = 3xn-1 - 31 • xn = 3xn-1 - 62
Observations • k-tuples from an LCG fall on at most (k!m)1/kparallel hyperplanes, where m is the modulus • M = 232 • 3-tuples will have < 2953 hyperplanes • 4-tuples, < 566 hyperplanes • 10-tuples, < 41
Another Spectral Test Example • xn = 3xn-1 % 31 • Period: 30 • Pass chi-square test • 3 lines • xn = 13xn-1 % 31 • Period: 30 • Pass chi-square test • 10 closer lines • Better 2-distributivity