Download

1 / 6
70 likes | 175 Vues
Explore the significance of costs in maximizing profits for firms and how costs, both explicit and implicit, impact production decisions. Learn about production functions, total costs, and the relationship between input quantities and output.

E N D
13 The Costs of Production
What Does a Firm Do? • Firm’s Objective • Firms seek to maximize profits • Profits = Total Revenues minus Total Costs • Choose Q such that Max {TR(Q*) –TC{Q*} • Total revenue • Revenue received fromsale of its output • Total cost • Market value of the inputs a firm uses in production
Why Are Costs Important to a Firm? • Primary economic objective of a firm • Maximize profits • Total revenues depend on customer demand • Tot Rev(Q) = Price(Qd) x Qd • Price-taker (competitive world) • Initially assume: firm is a Price-taker (competitive world) • Competitors numerous and perfect substitutes • Demand is perfectly elastic • Tot Rev is not controllable by firm • Costs {can controlled by p-taking firm} • Depend on amount supplied (Q*) by the firm • prices of and amounts used of inputs
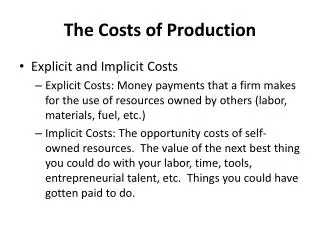
What are Costs? • Costs as opportunity costs • Explicit costs • Input costs that require an outlay of money by the firm • Reflect value of input used by other producers/markets – price willing to pay • Implicit costs • Input costs that do not require an outlay of money by the firm • Opportunity costs of time; alternative investment
1 A production function and total cost: Caroline’s cookie factory
2 Caroline’s production function and total-cost curve Quantity of Output (cookies per hour) Total Cost (a) Production function (b) Total-cost curve Production function Total-cost curve $90 30 20 10 40 50 60 70 80 100 160 140 120 40 20 80 60 160 140 120 100 20 40 60 80 1 2 3 4 5 6 Number of Workers Hired Quantity of Output (cookies per hour) 0 0 The production function in panel (a) shows the relationship between the number of workers hired and the quantity of output produced. Here the number of workers hired (on the horizontal axis) is from the first column in Table 1, and the quantity of output produced (on the vertical axis) is from the second column. The production function gets flatter as the number of workers increases, which reflects diminishing marginal product. The total-cost curve in panel (b) shows the relationship between the quantity of output produced and total cost of production. Here the quantity of output produced (on the horizontal axis) is from the second column in Table 1, and the total cost (on the vertical axis) is from the sixth column. The total-cost curve gets steeper as the quantity of output increases because of diminishing marginal product.