Download

1 / 62
620 likes | 738 Vues
Higher education overview North west University march 2012. Economic Growth and Human Development.

E N D
Higher education overview North west University march 2012
Economic Growth and Human Development A substantial body of academic and technical literature provides evidence of the relationship between informationalism, productivity and competitiveness for countries, regions and business firms. But, this relationship only operates under two conditions: organizational change in the form of networking; and enhancement of the quality of human labor, itself dependent on education and quality of life. (Castells and Cloete, 2011) The structural basis for the growing inequality, in spite of high growth rates in many parts of the world, is the growth of a highly dynamic, knowledge-producing, technologically advanced sector that is connected to other similar sectors in a global network, but it excludes a significant segment of the economy and of the society in its own country. The lack of human development prevents what Manuel Castells calls the ‘virtuous cycle’, which constrains the dynamic economy. (Castells and Cloete, 2011) Connecting growth to human development – trickle down don’t work
Gross Domestic Product (GDP) per capita vs Human Development Index (HDI)
Economic Growth in Post Apartheid SA During the first decade of the post-apartheid era in South Africa, gross domestic product (GDP) grew at a ‘modest rate’, averaging one percent, though edging up more recently to three percent. Nevertheless, this has been the longest period of positive growth in its history How did this growth happen? The envisaged post-1994 economic policies for the development project stated that the economy would require steering onto a new development path which, amongst others, would reduce dependence on resource sectors through industrial deepening and diversification (Bhorat 2010).
Economic Growth and the 2008 Financial Crisis The worst impact of the 2008crisis, resulted in at least a million job losses, and is associated with: • structural industrial weaknesses and de-industrialization as a result of development centred around mining and minerals • continued reliance on extractive mining and minerals exports • consumption led growth and increased investment in services sectors, such as finance and retail • speculative asset bubbles in real estate and finance and increased construction (mainly around the 2010 Soccer World Cup) and car sales • the role of the financial sector which has emulated the behaviour of US financial institutions in increasing leverage and misallocation of capital in SA economy. (Mohamed 2009)
Poverty Reduction in Post Apartheid SA The stated goal of the post-apartheid economic policy was to reduce poverty, inequality and unemployment. A 2% growth should lead to a 1-7% reduction in poverty, depending on the country – meaning the success of redistributive policies (Bhorat 2010a). In South Africa, poverty declined from 52% in 1995 to 49% in 2005 and in the lower poverty group a 7% decline (31% to 24%). In addition, there were definite gains in poverty reduction, particularly in African female-headed households (Bhorat 2010a). All people, regardless of race, experienced increases in expenditure, meaning that growth was ‘pro-poor’. Despite the modest gains in poverty reduction, the inequality gap did not decrease; instead, it increased amongst all groups. This led Bhorat (2010a) to conclude that in 1994 South Africa was ‘one of the world’s most unequal societies, but by 2005 it may have become the world’s most unequal’.
Poverty Reduction in Post Apartheid SA While spending on education and health remained fairly constant in real terms, recipients of social grants (excluding administration) now consumes 3.2% of GDP, up from 1.9% in 2000/01. The total number of beneficiaries increased from 3 million in 1997 to 15 million in 2010 (Woolard and Leibrandt 2011). The share of households in the first income decile with access to grant income increased from 43% in 1995 to almost 65% in 2005 and that even for households in the sixth decile grant income increased from 19% in 1994 to 50% in 2005. According to Bhorat (2010a) this suggests that grant income does not only support the very poor, but also a large number of households in the middle income distribution. More recent estimates suggest that 25% of the population are on social grants and 40 per cent of household income in the poorest quintile (Woolard and Leibbrandt 2011). Post-1994 South African democratic redistribution model operates through extensive social grants at the bottom end, few benefits at the middle of the distribution curve and the main growth is at the de-racialising top end. Based on this growth path, both Bhorat (unequal income distribution) and Mbeki (the disempowerment of welfarism) express concern for the future of democracy.
Higher Education and Development • SA has a development crisis • Connecting Growth to Human Development • Castells project of Finland, Chile, Taiwan, Costa Rica, SA and California • Two aspects of Higher Education that I want to concentrate on are Knowledge production (growth) and participation (skills and equity)
The relationship between scientific excellence and economic development (R = 0.714, P = 0.218) (R = 0.961, P = 0.002)* Data source: Thomson Reuters InCitesTM (21 September 2010); The World Bank Group (2010) Vuyani Lingela, 24 November 2011
Knowledge Production: SA International Performance According to the NPC: • SA produces 28 PhD graduates per million of the population while UK =288; US = 201; Australia=264; Korea=187; Brazil = 48 • World Bank: SA has tripled R&D investment since 1994, but the total number of FTE researchers increased by only 33%. SA has approximately 1.5 FTE researchers per 1000 employed; countries with similar ratio of R&D to GDP expenditure like Portugal = 4.8 and Italy = 3.6 • NPC goals: Increase PhD graduates from 1420 to 5000 p.a and increase percentage of staff with PhD’s from 34% to 75%
BRICS: Selected higher education and economic development indicators (WEF 2010)
Gross participation rates in SA higher education by Race, 1986 - 2009
Effective Participation: Throughput rates of general academic first-B-degrees
Knowledge EconomyCentral role of knowledge in government policiesFocus in Knowledge Policies on:1. Global economic competitiveness2. Innovative capacity of societies3. High Level Skills and Competencies of Labour force (Knowledge workers)Core issue: Most effective investment of public fundsClaus Swabe (WEF) Not Capitalis, but Talentism
International Knowledge Policies – Maassen Starting point = New conditions in the global economy Growing focus of national (regional – supranational) policy makers and other central socio-economic actors on the university as a driver for economic growth through its role as source for innovation and job creation. Consequence = Two new university governance aspects First targeted policies for and investments in universities’ research capacity are assumed to be needed in order to improve the global competitiveness of a specific economy. Second, targeted policies for and investments in connecting the enhanced research capacity of universities to the knowledge needs of society (incl. private and public sector companies and organisations) in order to ensure the link of new knowledge to economic growth (innovation & new jobs ). «Balancing academic excellence with economic relevance»
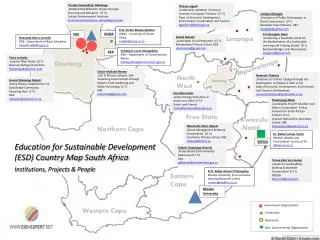
HERANA: 8 African Countries and Flagship Universities Higher Education Research and Advocacy Network in Africa • Starting point is to increase understanding of the complex links/interactions between higher education and economic development – at national and institutional levels • Three successful systems – Finland, South Korea and North Carolina (USA) • Eight African countries and their national universities: Botswana, Ghana, Kenya, Mauritius, Mozambique, South Africa (Nelson Mandela Metropolitan University/UCT), Tanzania, Uganda • Network consists of 50 people from 15 countries, include Manuel Castells, Peter Maassen (Oslo) John Douglas (Berkeley) and Pundy Pillay (Wits) Funded by: Ford, Carnegie, Rockefeller, Kresge and Norad
Findings from Three Successful Systems Finland, South Korea, North Carolina (USA) • As part of reorganising their ‘mode of production’, a pact was reached about a knowledge economy (high skills and innovation) as development driver • Close links between economic and education planning • High participation rates with differentiation • Strong ‘state’ steering (projects) • Higher education linked to regional development • Responsive to the labour market • Strong coordination (prime ministers office) and networks Pundy Pillay (2010) Linking higher education to economic development: Implications for Africa from three successful systems (CHET)
HERANA Findings on 8 African Countries and Flagship Universities • There is a lack of agreement (pact) between national and university stakeholders about a development model, and about the role of higher education in development • Only one of the eight countries (Mauritius) has accepted knowledge, and the associated human capital and research development, as a key driver for economic growth • Linking higher education to development requires considerable coordination within government, and between government, the university and external funders, and all three must contribute • The absence of a pact about the role of the university in development affects negatively implementation and resource allocation – which raises the possibility that we a have double problem; lack of capacity and a lack of agreement
Dis-coordinated Knowledge Policies • Department of Higher Education and Training • Shocked by Chet’s finding of 3 million NEET’s and have become ‘overwhelmed’ with FET and training • In Ministers budget speech referred to research on page 12 of 13 and never used knowledge economy and Africa, not to mention the globe (a local communist) • Department of Science and Technology • Opening line knowledge economy and global competitive • Presses all the knowledge production buttons • Never spoke beyond pleasantries to DHET advisor • Two Departments focus on different and over-lapping aspects of the system, without any co-ordination
National Planning Commission (Nov 2011): Functions of HE (1) Higher education is the major driver of the information-knowledge system, linking it with economic development...Universities are key to developing a nation. They play three main functions in society: Firstly, they educate and train people with high-level skills for the employment needs of the public and private sectors. Secondly, universities are the dominant producers of new knowledge, and they critique information and find new local and global applications for existing knowledge. Universities also set norms and standards, determine the curriculum, languages and knowledge, ethics and philosophy underpinning a nation's knowledge-capital. South Africa needs knowledge that equips people for a society in constant social change
NPC: Functions (2) "Thirdly, given the country's apartheid history, higher education provides opportunities for social mobility and simultaneously strengthens equity, social justice and democracy. In today's knowledge society, higher education underpinned by a strong science and technology innovation system is increasingly important in opening up people's opportunities." (p262) For the first time knowledge production and equity are linked by stating that "high quality knowledge production cannot be fully realized with a low student participation rate" (p274). Also universities are not mainly fro individual mobility or for equity redress - equity is mentioned last and transformation in the Castells sense
NPC: Knowledge Enthusiasm The NPC is so enthusiastic about knowledge that it declares that "knowledge production is the rationale of higher education" (p271) - indeed a radical departure from the traditional 'rationale' of higher education in Africa, that is, disseminating (teaching) knowledge from somewhere else. Posters outside Parliament for Thursday’s State of the Nation: Knowledge Economy and Development Opportunities. At ANC 100th Zuma said: “Education and skills are the key priority for our people” These are huge steps away from HE as individual mobility and an equity instrument – but in State of Nation announced the biggest infrastructure project in history – not a word of KE
NPC Knowledge Policies • the notion of knowledge production consists of a combination of PhD education and research output. • a target of tripling the number of doctoral gradates from 1,420 to 5,000 per annum, and increasing the proportion of academic staff with PhDs from 34% to 75% • a number of world-class centres and programmes should be developed within the national system of innovation and the higher education sector. • a new future scholars programme needs to be developed, both to increase the proportion of staff with PhDs and to meet the increasing demand for professional PhDs in the non-university research, financial and services sectors • role of science councils should be reviewed in light of the world-wide tendency to align, or merge, research councils with universities
NPC: Differentiation • deals with the worldwide policy debate about the concentration of resources by proposing world-class centers and programmes across institutions (High science - Ska) • advises the Ministerial Committee for the Review of the Funding of Universities that such revisions should be based on the needs of a differentiated system with adequate provision for both teaching and research • requires flexible pathways for student mobility between institutions • the Higher Education Quality Committee should finally start developing a core set of quality indicators for the whole system;
DHET Green Paper Research and innovation • Economic depends on innovation and technology absorption • While investment in research has tripled, there has not been a commensurate increase in personnel • Total knowledge output has increased 64% (2000-2009) but the system must become more productive • Poverty is a significant constraint on masters and Phd studies – students under pressure to obtain jobs?? • Drastically increase number and quality of masters and PhD’s • Need for increased coordination between DHET and DST • Caliber and workload of academic staff must be addressed • Long term plan for renewing the academic profession - doctorates for academics and professions
NPC and DHET: The Good, the Bad and the Incomprehensible • Differentiation (whatever form) is official • Knowledge production (PhD and research output must increase – different counts of research outputs) – at last recognising the knowledge producing role of the university • Big focus on doctorate – for academics (target more than 60%), professions research councils and other sectors (finance) • Good quality undergraduate education – including infrastructure funds for labs, libraries, housing • Improvement of through put – efficiency • Dramatic increase in participation rate – mainly in FET • Mission and profile differentiation • Creation of a connected system • Improved Coordination between DSHT and DHET (HESA meeting) • More funding for higher education
Ten Year Innovation Plan • The Government of South Africa is implementing the Ten Year Innovation Plan which includes five “Grand Challenges” that build on and expand the country’s research capabilities (Minister Naledi Pandor, 2009). • The first grand challenge is to tap the potential of the bio-economy for the pharmaceutical industry. • The second grand challenge is to build on investments in space science and technology. • The third grand challenge is to move towards the use of renewable energy. • The fourth grand challenge is to play a leading, regional role in climate change. • The fifth and final grand challenge is termed “human and social dynamics”. Vuyani Lingela, 24 November 2011
* Mauritius enroll large numbers of students as MPhil students, and depending on their performance only some graduate as PhD students
KP outputs: Universities of Sao Paolo, Pretoria and Cape Town
Summary • Unprecedented shift from HE as instrument to advance equity and individual mobility to HE as crucial part of development • Policy recognition of importance of coordination of policy and implementation, but little sign of positive cooperation yet • SA a Medium knowledge producing system, rated around 30th in the world • SA has a few global high visibility big science projects • SA seems to be doing better in research output than in producing doctorates • Over –enthusiasm about dramatic increase in doctoral production • Next session on the Doctoral Project will explore this ‘doctoral exuberance’ through different empirical prisms (Alan Greenspan initially attributed the 2008 crash to ‘irrational market exuberance’).
Doctoral enrolments, doctoral graduates and research publications Graph 1 sets out data on key elements of SA’s high-level knowledge production for the period 1996-2010 expressed as doctoral enrolments, doctoral graduates and research publication units. Average annual changes in these totals are reflected in Graph 2.
Average annual changes: enrolments, graduates and publications Graph 2 divides Graph 1 growth rates into the period between (a) 1996 and 2002, which covered the period of the 1997 HE White Paper and the 2001 National Plans, and (b) 2004-2010 which covered the introduction and implementation of the new 2003 government funding framework.
Doctoral enrolments by race group Graph 3 divides the doctoral enrolment totals for 1996-2010 into race groupings. The main change has been in African doctoral enrolments, which increased from 663 in 1996 to 5066 in 2010, when African doctoral enrolments exceeded that of White enrolments for the first time.
Percentage of doctoral enrolments in race groupings Graph 4 shows how the % of doctoral enrolments by race group changed between 1996 to 2010. African doctoral students rose from 13% in 1996 to 33% in 2004, and 44% in 2010.
Graduation rates and cohort output equivalents Graph 5 offers a first picture of the doctoral output efficiency of SA’s public HE system, based on output ratios which appear in the 2001 National Plan. The National Plan set this as an output norm: The ratio between doctoral graduates in a given year and doctoral enrolments should = 20%. So, if 10 000 doctoral students were enrolled in the HE system in year X, then at least 200 of these students should graduate in year X. This norm was based on a further target norm that at least 75% of any cohort of students entering doctoral studies for the first time in (say) year Y, should eventually graduate. Calculations had shown that if the cohort output norm was to be achieved, then the 20% ratio of total graduates to total enrolments would have to be met over a period of time.
Graduation rates and cohort output equivalents Graph 5 shows that, as far as doctoral outputs are concerned, the Public HE system has failed to meet the National Plan’s efficiency targets. Calculations show that over the period 1996–2002, less than 50% of students entering doctoral programmes in SA will eventually graduate.
Actual doctoral graduates vs normative totals on National Plan target ratio Graph 6 offers estimates of the effects of inefficiencies in SA’s doctoral programmes. For example, over the period 2005-2010, SA should, on the National Plan’s norms, have produced a total of 12 285 doctoral graduates but in fact produced only 7 711, leaving a “shortfall” of 4 739 graduates (who would have been drop outs from the system).
The End of year 7 dropping out numbers also include students that may have registered in future years to complete their studies. Source: DHET. 2011, CHET PhD analysis
It is important to note that the two countries produce almost the same number of PhD graduates but that South Africa’s population is in the order of 48 million whilst Norway’s population is 4.8 million
Permanent academic staff Academic staff with doctoral degrees are a key input for high-level knowledge production is. Permanent academic staff in this category should be the major producers of research outputs, and at an input level the main supervisors of doctoral students. Graph 7 shows how the totals of permanent academic staff with doctoral degrees changed between 1996 and 2010.
Percentage of academic staff with doctorates by institutional category Graph 8 divides public HE institutions into the 3 categories used for national planning purposes, and sub-divides the 11 universities into a group of 6 which produces 60% of the HE system’s total high-level knowledge products and the remaining 5. The groups are:
Percentage of academic staff with doctorates by institutional category Graph 8
Ratios of doctoral enrolments to academic staff with doctorates The low proportions permanent academic staff with doctoral degrees must have an impact on the numbers of doctoral students which can be enrolled and supervised. Graph 9 shows what the ratios have been between doctoral enrolments and permanent academic staff with doctorates. A ratio of two doctoral enrolments per permanent academic with a doctorate could be used as an indicator of institutional capacity. Graph 9 shows that the high productive group of universities and the comprehensives had ratios above 2 in 2010, which could be taken to imply that they have reached capacity as far as doctoral enrolments are concerned. Increases in their doctoral enrolments should depend on more academic staff obtain their own doctoral degrees. The 2:1 norm suggests that the other group of 5 universities and the universities of technology may have spare supervisory capacity, but their ability to deal with this depends on their current financial and efficiency levels.
Ratios of doctoral enrolments to academic staff with doctorates Graph 9
Government research funding allocations by output category and financial year Government’s funding incentives for research outputs are complex because of the 2-year time lag between the completing of an output and the receipt of a funding allocation, and the weightings applied to research outputs. Graph 10 shows what research funding totals were generated by each output category. Graph 11 shows what the Rand values can be assigned to research output units.
Government research funding allocations by output category and financial year Graph 10