Download
1 / 7
80 likes | 541 Vues
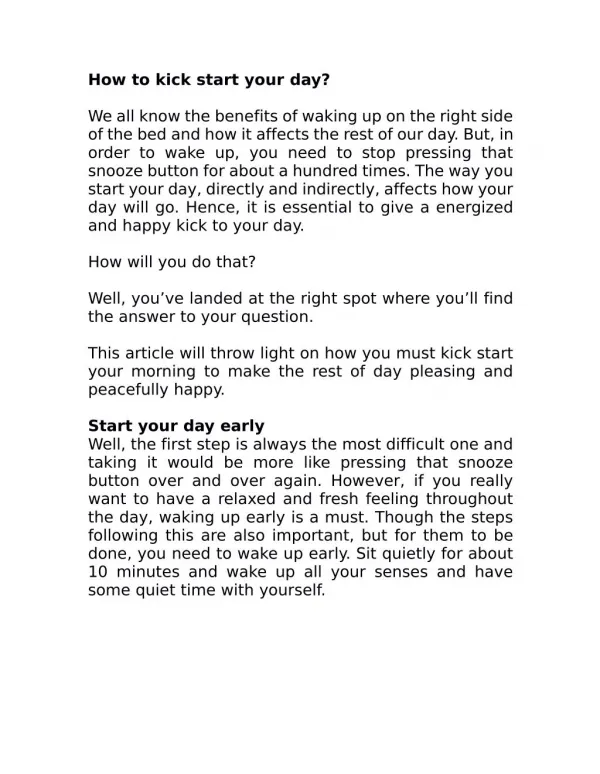
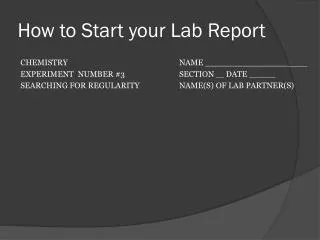
How to Start your Lab Report. CHEMISTRY NAME ________________ EXPERIMENT NUMBER #3 SECTION DATE SEARCHING FOR REGULARITY NAME(S) OF LAB PARTNER(S). Searching for Regularity. Objective: To observe mathematical and graphical relationships between mass and volume. Procedure:.

E N D
How to Start your Lab Report CHEMISTRY NAME ________________ EXPERIMENT NUMBER #3 SECTION DATE SEARCHING FOR REGULARITY NAME(S) OF LAB PARTNER(S)
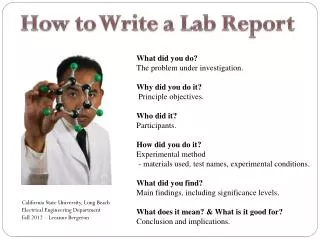
Searching for Regularity • Objective: To observe mathematical and graphical relationships between mass and volume
Procedure: • Mass a metal object to the nearest 0.01 g. • Fill a graduated cylinder to the 30.0 ml mark with water. • Carefully add the metal object to the water and record the water displacement. • Record data on your data table. • Repeat these steps for the other metal objects. • Obtain mass and volume data from other members of the class. • Plot average mass and volume. Record mass along the vertical axis and volume along the horizontal axis. Give the graph a title. • State the regularity and propose an explanation for what you observed on your graph. • Draw lines to represent the mass-volume relations.
Data: • Collect mass and volume in a chart, similar to the following :
Data: • Obtain mass and volume data from other members of the class. • Plot average mass and volume. Record mass along the vertical axis and volume along the horizontal axis. Give the graph a title.
Conclusion: • Propose an explanation for what you observed on your graph.