Download

1 / 39
390 likes | 571 Vues
Land-Atmosphere Feedback in the Sahel. Randal Koster Global Modeling and Assimilation Office NASA/GSFC Greenbelt, MD randal.d.koster@nasa.gov. Organization of Talk Overview of the processes that control land-atmosphere feedback. (Case study: North America)

E N D
Land-Atmosphere Feedback in the Sahel Randal Koster Global Modeling and Assimilation Office NASA/GSFC Greenbelt, MD randal.d.koster@nasa.gov
Organization of Talk • Overview of the processes that control land-atmosphere feedback. (Case study: North America) • Application of these ideas to the Sahel: do the observations support the existence of feedback there? • 3. Model study of the controls on Sahelian rainfall variability.
0. 0.5 0.8 1.3 2.0 3.2 5.0 8.0 0.13 0.20 0.32 Warm season precipitation variance is often high in transition zones between dry and wet areas. Example: North America July Rainfall: Mean July Rainfall: Variance [mm/day] [mm2/day2] Observations (Higgins, 50-yr dataset) Koster et al., GRL, 40, 3004
More evidence: tree ring data! (360 years of proxy precipitation data put together by H. Fritts, U. Arizona) Jul/Aug precipitation variances at each tree ring site Shading: Mean annual precipitation (GPCP) White dots: Locations of tree ring sites with Jul/Aug precipitation variances in top half of range
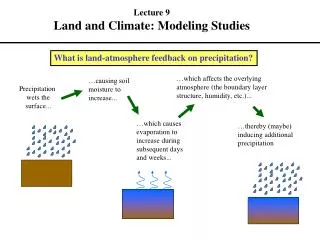
Q: Do we have any reason to suspect that precipitation variances should be amplified in transition zones? A: Yes. Transition zones are more amenable to land-atmosphere feedback. …which affects the overlying atmosphere (the boundary layer structure, humidity, etc.)... …causing soil moisture to increase... Precipitation wets the surface... …which causes evaporation to increase during subsequent days and weeks... …thereby (maybe) inducing additional precipitation
Observeds2P Feedback enhances s2P through the enhancement of P autocorrelation (on timescales of days to weeks). correlates with Pn Pn+2 means that Pn Pn+2 correlates with correlates with En+2 correlates with wn wn+2 correlates with
Observeds2P Feedback enhances s2P through the enhancement of P autocorrelation (on timescales of days to weeks). correlates with Pn Pn+2 means that Pn Pn+2 Breaks down in western US: low evaporation correlates with correlates with Breaks down in western US: low soil moisture memory En+2 correlates with wn wn+2 correlates with
Observeds2P Feedback enhances s2P through the enhancement of P autocorrelation (on timescales of days to weeks). correlates with Pn Pn+2 means that Pn Pn+2 correlates with correlates with En+2 correlates with wn wn+2 Breaks down in eastern US: low sensitivity of evaporation to soil moisture correlates with
Observeds2P Feedback enhances s2P through the enhancement of P autocorrelation (on timescales of days to weeks). correlates with Pn Pn+2 Only in the center of the country (in the wet/dry transition zone) are all conditions ripe for feedback means that Pn Pn+2 correlates with correlates with En+2 correlates with wn wn+2 correlates with
We therefore have reason to believe that land-atmosphere feedback can help explain the patterns of observed precipitation variances. Note: up to this slide, we haven’t looked at any model results! What can AGCMs tell us?
Correlations (pentads, twice removed) July Rainfall: Variance [mm2/day2] [dimensionless] 0. 0.12 0.16 0.24 0.50 0.08 -0.24 -0.50 -0.16 -0.12 -0.08 0. 0.5 0.8 1.3 2.0 3.2 5.0 8.0 0.13 0.20 0.32 July Rainfall: Mean [mm/day] AGCM AGCM, no feedback Observations (Higgins, 50-yr dataset) same plots as before
Correlations (pentads, twice removed) July Rainfall: Variance [mm2/day2] [dimensionless] 0. 0.12 0.16 0.24 0.50 0.08 -0.24 -0.50 -0.16 -0.12 -0.08 0. 0.5 0.8 1.3 2.0 3.2 5.0 8.0 0.13 0.20 0.32 July Rainfall: Mean [mm/day] AGCM bulls-eye in model is definitely induced by feedback! AGCM, no feedback Observations (Higgins, 50-yr dataset) The observations show statistics that are similar in location and timing, though not in magnitude, to those produced by the GCM. This is either a coincidence or evidence of feedback in nature.
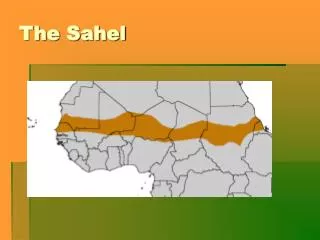
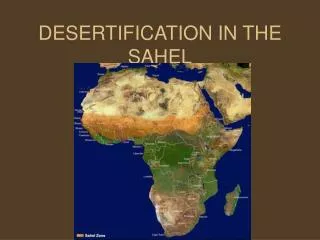
Central North America, of course, is just one of the Earth’s wet/dry transitions zones. Annual Precipitation Another is the Sahel… Does nature allow land-atmosphere feedback to affect rainfall statistics in the Sahel?
Precipitation Variances (mm2/day2) AGCM The comparison between model results and observations isn’t as clear-cut as it is in North America, but it is suggestive… AGCM with no land feedback Observations
Precipitation Variances (mm2/day2) AGCM The comparison between model results and observations isn’t as clear-cut as it is in North America, but it is suggestive… AGCM with no land feedback Observations The dots show where precipitation itself is maximized
Another observational study If land-atmosphere feedback operates in the Sahel, then realistic land initialization there should lead to improved monthly forecasts. Test with comprehensive forecast study: 75 start dates (first days of each month: May to September) 9 ensemble members per forecast In one set of forecasts, utilize realistic land ICs In other set, don’t utilize realistic land ICs Compare
Forecast skill resulting from realistic land surface initialization appears negligible for precipitation… Differences: Added forecast skill from realistic land ICs Skill from knowing SST distribution and realistic land ICs Skill from knowing SST distribution Precipitation Precipitation Precipitation Temperature Temperature Temperature
HOWEVER, locations for which the rain gauge density is adequate enough to properly initialize the model are arguably very limited. Added forecast skill from land initialization Precipitation Regions w/adequate raingauge density and model predictability Temperature
So, for the feedback question, observations are limited. Consider now a pure model study... # of Total Exp. simulations Length years Description Evaporation efficiency (ratio of evaporation to potential evaporation) prescribed at every time step to seasonally-varying climatological means A 4 200 yr 800 AL 4 200 yr 800 AO 16 45 yr 720 ALO 16 45 yr 720 Prescribed, climatological land; climato- logical ocean Interactive land, climato- logical ocean Prescribed, climatological land, interan- nually varying ocean SSTs set to seasonally-varying climatological means (from obs) SSTs set to interannually-varying values (from obs) Interactive land, interan- nually varying ocean LSM in model allowed to run freely Koster et al., J. Hydromet., 1, 26-46, 2000
Simulated precipitation variability can be described in terms of a simple linear system: Total precipitation variance Precipitation variance in the absence of land feedback s2ALO s2ALO= s2AO[ Xo + ( 1 - Xo ) ] s2AO Fractional contribution of ocean processes to precipitation variance Land-atmosphere feedback factor Fractional contribution of chaotic atmospheric dynamics to precipitation variance The above tautology isolates the relative contributions of SSTs, soil moisture, and chaotic atmospheric dynamics to precipitation variability.
Idealized “predictability” (for 1-month forecasts, MJJAS) deduced from aforementioned forecast experiment. (“Ability of model to predict itself.”) Differences: Added predictability from realistic land ICs Predictability from SST distribution and realistic land ICs Predictability from SST distribution Precipitation Precipitation Precipitation Temperature Temperature Temperature Temperature
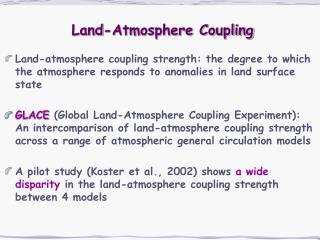
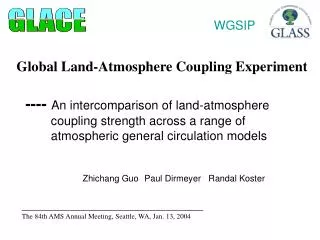
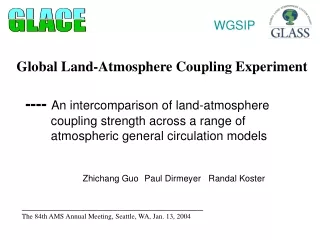
More AGCM results: The GLACE multi-model experiment. In GLACE, land-atmosphere feedback was quantified independently in 12 AGCMs. While the models differ in their feedback strengths, certain features of the coupling patterns are common amongst them. These features are brought out by averaging over all of the model results:
More AGCM results: The GLACE multi-model experiment. In GLACE, land-atmosphere feedback was quantified independently in 12 AGCMs. While the models differ in their feedback strengths, certain features of the coupling patterns are common amongst them. These features are brought out by averaging over all of the model results: The AGCMs tend to agree: land-atmosphere feedback operates in the Sahel.
To summarize: • Organization of Talk • Overview of the processes that control land-atmosphere feedback. (Case study: North America) • Application of these ideas to the Sahel: do the observations support the existence of feedback there? • 3. Model study of the controls on Sahelian rainfall variability.
To summarize: • Organization of Talk • 1. Overview of the processes that control land-atmosphere feedback. (Case study: North America) • 2. Application of these ideas to the Sahel: do the observations support the existence of feedback there? • 3. Model study of the controls on the West African monsoon. We think we understand the impact of land-atmosphere feedback on the statistics of precipitation in North America. Through feedback, precipitation memory and variance are increased in the transition zones between wet and dry areas. The observations appear to support this.
To summarize: • Organization of Talk • 1. Overview of the processes that control land-atmosphere feedback. (Case study: North America) • 2. Application of these ideas to the Sahel: do the observations support the existence of feedback there? • 3. Model study of the controls on the West African monsoon. Observations are too sparse in the Sahel (relative to North America) for an equally clear indication that land atmosphere feedback operates there. Nevertheless, the available observations are not inconsistent with feedback.
To summarize: • Organization of Talk • 1. Overview of the processes that control land-atmosphere feedback. (Case study: North America) • 2. Application of these ideas to the Sahel: do the observations support the existence of feedback there? • 3. Model study of the controls on Sahelian rainfall variability. The NSIPP model (and indeed most of the models participating in GLACE) show the Sahel to be a region of strong land-atmosphere feedback.
The above modeling results may, of course, be model dependent. A new, upcoming experiment may provide a clearer look at the controls on monsoon dynamics… See website: http://wamme.geog.ucla.edu/ A Spring AGU (Acapulco) session addresses the experiment…
time step n Experiment Design W Simulations: Establish a time series of surface conditions time step n+1 Step forward the coupled AGCM-LSM Step forward the coupled AGCM-LSM Write the values of the land surface prognostic variables into file W1_STATES Write the values of the land surface prognostic variables into file W1_STATES (Repeat without writing to obtain simulations W2 – W16) All simulations are run from June through August
Experiment Design (cont.) R(S) Simulations: Run a 16-member ensemble, with each member forced to maintain the same time series of surface (deeper) prognostic variables time step n+1 time step n Step forward the coupled AGCM-LSM Step forward the coupled AGCM-LSM Throw out updated values of land surface prognostic variables; replace with values for time step n from file W1_STATES Throw out updated values of land surface prognostic variables; replace with values for time step n+1 from file W1_STATES
Participating Groups Model Contact Country 1. BMRC with CHASM McAvaney/Pitman Australia 2. U. Tokyo w/ MATSIRO Kanae/Oki Japan 3. COLA with SSiB Dirmeyer USA 4. CSIRO w/ 2 land schemes Kowalczyk Australia 5. NCAR Oleson USA Canada 6. Env. Canada with CLASS Verseghy 7. GFDL with LM2p5 Gordon USA 8. GSFC(GLA) with SSiB Sud USA 9. Hadley Centre w/ MOSES2 Taylor UK 10. NCEP/EMC with NOAH Lu/Mitchell USA 11. NSIPP with Mosaic Koster USA 12. UCLA with SSiB Xue USA
S: GFDL Scale goes from 0 to 1 Differences: GFDL Scale goes from -0.5 to 0.5 W: GFDL Scale goes from 0 to 1
Another pure model study (no observations): monsoon rainfall What controls the timing of the monsoon? Quantify importance of: • Average solar cycle. • Interannual SST variations • 3. Interannual soil moisture variations Region considered
Illustration of W diagnostic (not for African monsoon region) Precipitation time series produced by different ensemble members under the same forcing All simulations in ensemble respond similarly to boundary forcing W is high Simulations in ensemble have no coherent response to boundary forcing W is low
The contributions of the different boundary forcings to the agreement (between ensemble members) of monsoon structure is established by analyzing the outputs of various experiments… NSIPP model solar, SSTs, soil moisture solar, SSTs solar, SSTs solar, W (Middle two bars differ because they were derived from different experiments, with different assumptions.)
The contributions of the different boundary forcings to the agreement (between ensemble members) of monsoon structure is established by analyzing the outputs of various experiments… NSIPP model solar, SSTs, soil moisture solar, SSTs solar, SSTs solar, W In this model, soil moisture variations have a major impact on monsoon evolution (Middle two bars differ because they were derived from different experiments, with different assumptions.)