Download
1 / 37
370 likes | 524 Vues
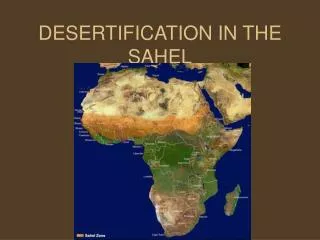
Mechanisms of land-atmosphere in the Sahel. Christopher Taylor Centre for Ecology and Hydrology, Wallingford, U.K. Richard Ellis, Phil Harris (CEH) Doug Parker (Leeds). Outline. Soil moisture - rainfall feedbacks on daily timescales Satellite analysis Aircraft observations (AMMA)

E N D
Mechanisms of land-atmosphere in the Sahel Christopher Taylor Centre for Ecology and Hydrology, Wallingford, U.K. Richard Ellis, Phil Harris (CEH) Doug Parker (Leeds)
Outline • Soil moisture - rainfall feedbacks on daily timescales • Satellite analysis • Aircraft observations (AMMA) • A dry case • A wet case
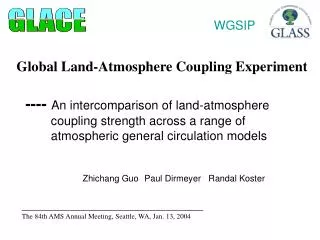
Soil moisture – rainfall feedbacks Shows where climate models sensitive to soil moisture Large “coupling strength” implies soil moisture has significant impact on precipitation i.e. feedback possible Large variations between models - models don’t represent basic processes well. Do we have observations to judge models by? Focus on West African “hotspot” Koster et al, Science 2004
How strong should coupling be? • What are mechanisms? • Are our parameterisations suitable?
Daily Variability in Surface Fluxes in Sahel • Evaporation limited by soil moisture so fluxes very sensitive to rainfall • For several days after rain: • large evaporation rates direct from soil • low sensible heat flux • low surface temperature Observations from savanna site at the start of the 1990 wet season (Gash et al)
Does daily surface variability matter in a GCM? Power spectra of simulated rainfall in HadAM3 Variations in surface fluxes on short timescales feed-back on simulated rainfall. Taylor and Clark, QJRMS (2001)
Impact of soil moisture on afternoon convection 12 June 2000 22:15 13 June Meteosat 7 TIR Polarisation ratio TMI Wet soil In this single case, extent of convective system influenced by soil moisture… Convection “avoids” wet soil
Results from 108 cases • Over 50% cases similar to example shown • 33% less cloud over wet soil than nearby drier zones • Initiation over wet soil strongly suppressed (2% cases) • Suggests a negative soil moisture – precipitation feedback for initiating storms (cf Taylor and Lebel 1998) • Potential mechanisms? Cold cloud extent 13 June Taylor and Ellis, GRL 2006
Aircraft Observations:African Monsoon Multidisciplinary Analyses Special Observing Period during 2006 Wet Season Focussed observations at multiple ground sites and with 5 aircraft, including NERC/Met Office BAe146 5 week deployment in Niamey, Niger
00:00 UTC 1 Aug 12:00 UTC 1 Aug A dry case study: 1 August 2006 17:00 UTC 31 July 12Z Aug 1 Meteosat thermal infra-red Initiating storm Niamey
Flight over storm track 18 hours later 1000 km Storm track Flight track Polarisation ratio anomalies from TRMM Spatial resolution ~ 50 km
Storm track Red contours show overnight storm from cloud top temperature Land Surface Temperature Anomalies Extract mean diurnal cycle to obtain Land Surface Temperature Anomaly (LSTA) 500 km Cold (wet) Warm (dry) White: no data (cloud or river)
PBL temperature according to ECMWF forecast model Observed PBL temperature PBL gradient due to vegetation feature Aircraft data within planetary boundary layer (PBL) Land surface temperature anomaly (satellite) Wettest soils Generally very good correlation between satellite surface data and PBL at fine scale: weak heating from wet soil>cool PBL
Aircraft data within planetary boundary layer (PBL) Similar story for specific humidity High values above wet surface
X X X: lifting condensation level Vertical profile data (dropsondes) Wet soil Pressure Dry soil PBL twice as deep over dry soil as wet, and markedly drier and cooler. More inhibition to convection over wet soil. In fact, no significant convection on this afternoon along track.
An impact on low level winds? If surface heating contrasts large enough, might expect a sea-breeze type response… i.e. convergence over dry (hot) surfaces So surface gradients ARE strong enough to induce circulations.
Convergence Divergence Divergence Convergence Convergence Low level wind vectors Land surface temperature anomaly Analysis suggests that soil moisture patterns strong enough to induce sea-breeze type circulations. Can they cause further storms on more favourable days?
A wet case study: 31 July 2006 wet dry wet Had similar flight planned previous afternoon… Very dry surface bounded by wet areas
Storm initiation during flight Aircraft track System developed very rapidly over dry soil as we approached.
Storm initiation Clouds over dry soil Due to convective inhibition or convergent winds?
Early evolution of storm Shading: land surface temperature (red=dry) Contours: cloud from visible channel Storm develops along wet-dry surface contrast Signature of triggering by circulation rather than thermodynamic profiles
Current work in AMMA • Quantifying surface fluxes (ALMIP) • Best available met forcing • Surface flux obs to calibrate models • Assimilation of LST data • Feedbacks on convective initiation • Role of circulations and/or thermodynamic profiles • MCS feedbacks • Sign and strength of feedback • Key space scales • Intraseasonal feedbacks • Wet/dry spells • Interannual memory • vegetation • Observational diagnostics to test atmospheric models
Hombori Tondo (Mali) from UK BAe146. Photo: Doug Parker
Soil moisture and monsoon dynamics • Intraseasonal variability in West African rainfall • Large-scale wetting/drying 15 day cycle • Cause and effect? Atmospheric warming Satellite soil moisture Surface heating (W/m2) T 925hPa (ECMWF)
Cause and effect: lagged relationships Composite data based on surface wetting TMI wetness ERA40 Temperature anomalies Satellite cold cloud Additional daytime cooling at 925hPa day 0 and day 1 - shows soil moisture leads to cooling in ECMWF analyses
Wet v Dry Spells Shading: surface heating Contours: 925hPa Temperature • During wet spells, “cool high” develops across Sahel • Dynamic response to soil moisture consistent with forcing of variability • Studentship with UEA looking at feedbacks in GCM
20 July 1992 22 July 1992 Convective scale feedbacks Rain gauge data from HAPEX-Sahel • From observations, found tendency of rain within squall lines to be heavier in locations that have been recently wetted • Linked to a positive feedback between soil moisture and rainfall at scales of only 10 - 15 km (Taylor and Lebel, MWR 1998)
Introduce wet patch of additional 1g/kg in lowest 1km 10 km 14 km 21 km Strong impact of patch on simulated rainfall Impact sensitive to patch length scale Modelling Impact of Moisture Anomalies on Convection Used cloud-resolving model (RAMS) to assess impact of humidity on cloud-scale dynamics within squall line. Run large ensembles. Unexpected sensitivity of feedbacks to length scale, convection sensitive to fine scale variability (Clark et al 2003 QJRMS, 2004 JHMet)
Synoptic Scale Surface Variability Warm Cool Screened TIR anomalies are well-organised at large scale (~1-2000 km) in N. Sahel
Alternate warm (dry) and cool (wet) surface anomalies travel westwards across the Sahel Synoptic Scale Surface Variability Black lines: cold cloud Cool surface features appear after rain Day Longitude
Impact of Synoptic Surface Variability on Atmosphere? 1000 km Produced composite “hotspot” from 2000 wet season to assess feedback of surface on atmosphere. Southerlies Observational analyses suggest: higher atmospheric temperatures lower surface pressure Anomaly TIR [C] vortex develops subsequent cold cloud (rainfall) modulated Northerlies Taylor et al QJRMS 2005 Degrees longitude
Identifying Wet Soil From Satellite • Several possibilities for detecting soil moisture from space • Passive microwave (10.65 GHz) from TRMM Microwave Imager to infer wet soil (high evaporation) after recent rain Rainfall (bars) and TRMM polarisation ratio (asterisks) in Banizoumbou region (Niger) Soil drying after rain Rainfall data courtesy of T. Lebel (IRD)
Thermal Data Meteosat Second Generation provides data every 15 mins at high spatial resolution (~3 km) Land surface temperature products produced by LandSAF in near real time