1 / 8

Jay Clark Heather Culnane Karen Long Lacey Steffey

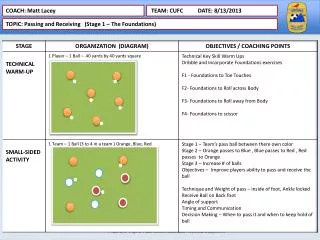
Jay Clark Heather Culnane Karen Long Lacey Steffey. NASDAQ – ARMS. Support and Resistance Levels. OHLC CHART. PERIOD: WEEKLY RANGE: 3 YEARS RESISTANCE: ~ 90 SUPPORT ~ 60. Exxon and Competition. Advance and Decline. Exxon Mobile (XOM). Market Advance and Decline. Head.

emilia
Télécharger la présentation

Jay Clark Heather Culnane Karen Long Lacey Steffey

An Image/Link below is provided (as is) to download presentation Download Policy: Content on the Website is provided to you AS IS for your information and personal use and may not be sold / licensed / shared on other websites without getting consent from its author. Content is provided to you AS IS for your information and personal use only. Download presentation by click this link. While downloading, if for some reason you are not able to download a presentation, the publisher may have deleted the file from their server. During download, if you can't get a presentation, the file might be deleted by the publisher.

E N D

Presentation Transcript


  1. Jay Clark Heather Culnane Karen Long Lacey Steffey

  2. NASDAQ – ARMS

  3. Support and Resistance Levels

  4. OHLC CHART PERIOD: WEEKLY RANGE: 3 YEARS RESISTANCE: ~ 90 SUPPORT ~ 60

  5. Exxon and Competition

  6. Advance and Decline • Exxon Mobile (XOM)

  7. Market Advance and Decline

  8. Head Right shoulder Left shoulder Neckline This is a head and shoulders top. The chart has several reversal patterns, which could mean that a main trend line may occur sometime soon. The stock chart for XOM is for the last 5 years.

More Related