Download
1 / 16
160 likes | 403 Vues
The Demand Response Baseline Alberta Electric System Operator – Demand Response Working Group December 9, 2008 Kenneth D. Schisler Senior Director, Regulatory Affairs and Public Policy. EnerNOC: Overview.

E N D
The Demand Response Baseline Alberta Electric System Operator – Demand Response Working GroupDecember 9, 2008Kenneth D. SchislerSenior Director, Regulatory Affairs and Public Policy
EnerNOC: Overview EnerNOC is a leading technology-enabled, commercial & industrial-focused demand response and energy management solutions provider • EnerNOC provides demand-side capacity, energy, and ancillary services to an aging North American electricity grid • Our technology-enabled commercial and industrial demand response solutions operate on a national scale in both regulated and restructured markets • 1,760 MW under management* • 3,400 sites under management* • Nearly 10% of the Fortune 500** • Assets roughly equivalent to 17 100-MW peaking power plants, with less environmental impact • In addition to demand response, EnerNOC offers a suite of energy management solutions including efficiency and procurement Active EnerNOC DR marketsEnerNOC Office *As of 9/30/08 **As of 6/30/08
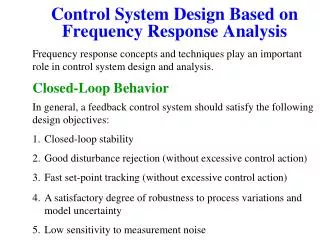
Why Baselines Matter • A properly designed baseline is perhaps the most important determinant of success for any DR program. • To measure DR performance, actual facility load must be compared with ‘business as usual’ load or what the load would have been but for the curtailment measures. • ‘Business as usual’ is estimated using a baseline methodology. • DR performance measurement is entirely dependent on this theoretical baseline figure. • Dozens of calculation methodologies have arisen representing a broad range of qualities. • Ultimately, a well-designed baseline should benefit all stakeholders, including end-use participants, aggregators, utilities, grid operators and ratepayers.
Four Key Baseline Qualities Accuracy Baseline must provide customers with credit for no more and no less than their actual curtailment. Integrity Baseline calculations must not encourage nor be influenced by manipulation. Simplicity Baseline and performance calculations must be simple enough for all stakeholders to calculate. Alignment Baseline design must facilitate performance in line with goals and the interests of all stakeholders.
Accuracy Integrity Simplicity Alignment Baseline Qualities – Finding the Right Balance Consider a regression calculation: • Accuracy - Maximized • Statistical analysis of extensive data delivers regression equation and parameters incorporating day-of conditions. • Integrity - Maximized • Complexity minimizes opportunity for manipulation or gaming. • Simplicity - Compromised • Substantial resources required to meet data and analysis needs while complexity limits availability of real-time performance info. • Alignment - Compromised • Lack of transparency between actual end-user actions and baseline calculation undermines DR performance. When considering different approaches, an effective baseline methodology must balance the four key qualities.
Calculating ‘Business as Usual’ While baseline calculations include a wide range of potential components, we believe the following three are most important: • Baseline shape • Does the baseline reflect the dynamic nature of demand across granular time intervals, or is it flat? • Baseline window and exclusion rules • Does baseline data come from a time window that sufficiently approximates normal operations across ‘like’ days? • Baseline adjustments • Does the baseline capture the day-of realities inherent in a customer load profile, or is it based entirely on historic data?
Baseline Shape – Profile Example • Profile Baseline • Also called a Customer Baseline or CBL. • Mimics the dynamic shape of customer demand across granular time intervals. • Baseline (red line) closely follows actual demand (blue line) leading up to the event. • Performance is calculated as the difference between baseline and actual demand measured at the meter, in this case 65kW.
Baseline Shape – Static Example • Static Baseline • Sometimes called Average Peak Monthly Demand (APMD). • Average of the peak demand from each month in a delivery season (e.g. previous summer). • Result is a flat baseline regardless of time interval. • Baseline (red line) in this case far greater than the actual pre-event load (blue line). • Performance is calculated as the difference between baseline and actual demand measured at the meter, in this case 83kW.
Accuracy Integrity Simplicity Alignment Baseline Shape – What We’ve Learned • A static baseline (such as APMD) maximizes simplicity, with a single flat baseline across time intervals. • While simple, the flat shape of the APMD approach presents problems: • Inaccuracy versus the natural variations in demand over the course of a multi-hour event; resulting in… • … misalignment of customer actions and rewards. • APMD creates other issues as well: • Potential for overstated performance due to reliance on peak demand numbers for all data points. • Historic nature of data can facilitate manipulation: • Consider a closed facility receiving credit based on comparison to prior year’s demand. Profile baselines represent the true shape of a customer’s demand curve while appropriately balancing accuracy, integrity, simplicity and alignment.
Baseline Window and Exclusion Rules • High ‘X’ of ‘Y’ Baseline Methodology • ‘Y’ represents the Baseline Window, for example a two week period. • ‘X’ represents the exclusion rule, for example the 5 highest weekday, non-holiday, non-event demand days within the Baseline Window. • There is growing consensus around the balanced qualities of a High 5 of 10 approach for resource adequacy or capacity DR programs. • A 10 day window is short enough to reflect the most recent operating conditions, but long enough to prevent undue emphasis on extreme short-term variations, and long enough to limit manipulation. • Because DR events occur on the highest demand days, a baseline that averages all of the window’s recent demand history will consistently understate performance. Exclusion rules mitigate this understatement. • For Economic or Energy Programs (responsive to price, not peak demand), we recommend a High 4 of 5 approach. • Contemporary data best mimics the economic conditions driving the event. • Because peak demand is not the primary consideration, less exclusion is required. Furthermore, because such a program uses a shorter Baseline Window, the exclusion of few days emphasizes integrity.
Baseline Window and Exclusion Rules – What We’ve Learned • Exclusion rules can be applied at the individual or the portfolio level • Applying exclusion rules at the portfolio level is problematic. • All constituents become dependent on portfolio calculations in order to evaluate performance, undermining simplicity. • From the customer’s perspective, randomly assigned days drive performance, blurring the relationship between actions and incentives, undermining alignment. • Actual data from a March 2008 DR event employing a High 3 of 10 method: • 91% of participants high 3 demand days did not align with portfolio’s high 3 demand days. Applying Exclusion Rules at the individual customer level is critical.
Baseline Adjustments • Customer demand is often heavier on event-days than on ‘like’ days alone. • For example, the first day of the season that requires air conditioning is likely to exhibit a different demand profile than prior cooler days. • Capturing day-of realities in a customer baseline is essential to delivering accurate performance calculations. • A recent LBNL study of baselines compared actual demand with High 3 of 10 baselines with (“BLP3”) and without (“BLP3n”) adjustments, concluding that “applying a morning adjustment factor significantly reduces the bias and improves the accuracy of all baseline load profiles”.1 This is consistent with our experience. 1 Lawrence Berkeley National Laboratory, “Estimating Demand Response Load Impacts: Evaluation of Baseline Load Models for Non-Residential Buildings in California”, January 2008, page 25
Baseline Adjustments – What We’ve Learned Adjustment Period Event Start Anticipatory Action Event End • Adjustments can reflect demand conditions symmetrically (up and down) or asymmetrically (only adjusted up). • From an alignment perspective, downward adjustments represent real concerns: • When day-of adjustment calculation includes time intervals subsequent to notification (such as with day-ahead events), participants can end up focusing on counter-productive behavior such as keeping load online. • Arguably most important, anticipatory actions are penalized (see graph). Asymmetric Baseline Actual Demand Symmetric Baseline Event from 2-4pm, anticipatory action reduces performance from 700kW to less than 100kW Upward adjustments prevent the perverse outcomes associated with downward corrections for day-of demand conditions.
Accuracy Integrity Simplicity Alignment Recommended Baseline Methodology – A Curtailment Service Provider’s Perspective • Profile baseline reflecting dynamic nature of customer load curve. • Exclusion rules applied at the individual customer level. • Application of upward adjustment to reflect day-of event conditions. The balance between accuracy, integrity, simplicity and alignment in a baseline methodology is critical to the success of a DR program.
EnerNOC, Inc. 75 Federal Street, Suite 300 Boston, MA 02110 617.224.9900 EnerNOC, Inc. 24 West 40th Street, 16th Floor New York, NY 10018 212.624.0000 EnerNOC, Inc. 321 Research Parkway Meriden, CT 06450 203.379.0121 EnerNOC, Inc. 594 Howard Street, Suite 400 San Francisco, CA 94105 415.227.4390 EnerNOC, Inc. 200 Pinegrove Cres Waterloo, ON N2L 4V1 226.220.1222 16