Download

1 / 24
240 likes | 339 Vues
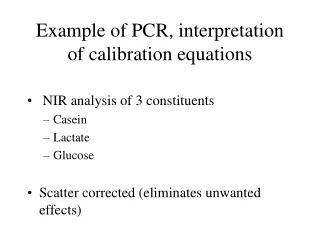
This workflow by Kurt J. Marfurt (University of Oklahoma) guides through identifying faults using coherence slices, vertical seismic lines, and 3D visualization. Quality control and correction methods are emphasized for accurate interpretation.

E N D
An example of a coherence-aided fault interpretation workflow Kurt J. Marfurt (University of Oklahoma)
Animate through a suite of coherence slice and identify strong discontinuities that persist with depth. • Pick an arbitrary vertical line through the seismic that is perpendicular to the fault (i.e. in the dip direction of the fault) t=1.0 s t=2.0 s t=3.0 s
Pick the fault on the vertical slice through the amplitude data. Note it does not correlate with any of the faults seen on the time slice through coherence at t=3.0 s. t=1.0 s t=2.0 s t=3.0 s
Note the fault does intersect the time slice at t=2.9 s. t=1.0 s t=2.0 s t=3.0 s
Pick the fault on one of the coherence time slices (this one is at t=2.0 s). The triangle in my software is formed by joining the pick on the time slice with that on the previous vertical slice.
Quality control the pick in your 3D visualization window. t=1.0 s t=2.0 s t=3.0 s
Pick the fault on the next coherence time slice (this one is at t=1.0 s). The surface in my software is formed by joining the pick on the time slice with that on the previous vertical slice.
Quality control the pick in your 3D visualization window. t=1.0 s t=2.0 s t=3.0 s
“Roll” your vertical line over 40 lines or so to begin to form a coarse grid to define your fault face.
My software projects the previously picked and interpolated fault face as a dotted line in this image. Notice it lines up nicely with the fault between t=1.0 and t=2.0 s. t=1.0 s t=2.0 s t=3.0 s
Using this guide, I pick the fault t=1.0 s t=2.0 s t=3.0 s
Quality control the pick in your 3D visualization window. Note the fault now intersects the time slice at t=3.0 s. t=1.0 s t=2.0 s t=3.0 s
Pick the fault on the next coherence time slice (this one is at t=3.0 s). The surface in my software is formed by joining the pick on the time slice with those on previous time and vertical slices. This fault is fuzzy, so I use it as a guide to correlate my subsequent picks on vertical lines. I may erase these picks later.
I add further control by picking on a coherence time slice at time t=0.5 s.
I add further control by picking the first and last lines (in this case an ‘inline’) on which I can see the fault. t=0.5 s t=1.0 s t=2.0 s t=3.0 s
I quality control my results. I have a nice smooth, geologically-reasonable fault surface constructed by picking 4 coherence time slices and 4 vertical seismic amplitude lines. Oftentimes, this fault surface may be sufficiently accurate to allow the interpretation to contnue. t=0.5 s t=1.0 s t=2.0 s t=3.0 s
Let’s examine the appearance of coherence on a vertical slice. This one is perpendicular to the fault surface. Note it has a stair-step appearance due to the finite bandwidth of the seismic wavelet. t=1.0 s t=2.0 s t=3.0 s
This pick was made on the vertical slice through the seismic amplitude volume. t=1.0 s t=2.0 s t=3.0 s
Let’s see what our fault looks like on a strike line. Note it appears to have a U-shape.
Faults are difficult to see and more difficult to pick on the strike line. t=1.0 s t=2.0 s t=3.0 s
Nevertheless, it is good practice to quality control your picks on strike lines to make sure the fault is geologically reasonable. Note the stray interpolated pick on the bottom of the image. t=1.0 s t=2.0 s t=3.0 s
Since coherence computations are done in a 3D window, they compare traces in both the strike and dip direction. For this reason the fault is somewhat easier to see on the vertical slice through the coherence image. t=1.0 s t=2.0 s t=3.0 s
Here is my final coherence image with the fault interpolated onto it. I may wish to adjust my fault pick somewhat on the right side of the figure. Otherwise, I am quite content with the results and ready to continue! t=1.0 s t=2.0 s t=3.0 s
Coherence-aided fault interpretation workflow • In Summary: • Animate through coherence images to identify large, through-going faults. • Pick a vertical line through your seismic data that is perpendicular to the coherence anomalies (perpendicular to the fault surface) • Interpret the fault on the vertical seismic lines and time slices through coherence to form a coarse grid of the fault surface • Use 3D visualization to interpolate the surface and quality control your results • Use strike lines through the fault surface to identify and correct serious mispicks (typically by picking a 2nd antithetic or otherwise intersecting fault).