Download
1 / 45
450 likes | 500 Vues
Understand EKG analysis in 5 steps - calculate heart rate, identify rhythms, and evaluate P waves, PR interval, and QRS complex. Practice interpreting sample strips to enhance skills.

E N D
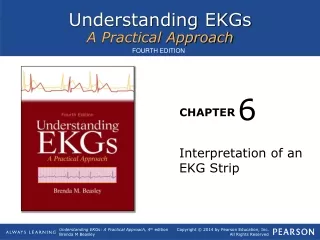
6 Interpretation of an EKG Strip
Interpretation of an EKG Strip • Objectives • Recall the general rules to use when correctly identifying heart rhythms • Describe the basic approach to interpretation of EKG strips • Discuss the five steps used in interpretation of EKG strips
Interpretation of an EKG Strip • Objectives • Explain how to calculate heart rate, given a 6-second strip • Name four causes of artifact
General Rules • First and most important, look at your patient • Read EVERYstrip from left to right, starting at the beginning of the strip • Apply the five-step systematic approach that you will learn in this chapter • Avoid shortcuts and assumptions
General Rules • A quick glance at a strip will often lead to an incorrect interpretation • Ask and answer each question in the five-step approach in the order that is presented here… this is important for consistency
General Rules • Master the accepted parameters for each dysrhythmia and apply them to each of the five steps when analyzing the strip
The Five-Step Approach • This five-step approach, in order of application, includes analysis of the following • Step 1: Heart rate • Step 2: Heart rhythm • Step 3: P wave • Step 4: PR interval • Step 5: QRS complex
Step 1: Heart Rate • Number of electrical impulses as represented by PQRST complexes conducted through the myocardium in 60 seconds (1 min) • Atrial rate • Counting the number of P waves noted • Ventricular rate • Counting the number of QRS complexes noted
Heart Rate • SA node discharges impulses at a rate of 60–100times per minute • Bradycardia • Heart rate less than 60 BPM • Tachycardia • Heart rate greater than 100 BPM
Heart Rate Determination • Two methods of determination of the heart rate • The 6-second method • Denotes a 6-second interval on EKG strip • Strip is marked by 3-or 6-second tick marks on the top or bottom of graph paper • Count the number of QRS complexes occurring within the 6-second interval and then multiply that number by 10
Two Methods to Determine Heart Rate • Two methods of determination of the heart rate • Second method is theR-R interval method • Most accurate if heart rate is regular • An estimation of the heart rate
Two Methods to Determine Heart Rate • Two methods of determination of the heart rate • Second method is the R-R interval method • Look at QRS complex that falls on a heavy line on the strip, count number of large boxes between this R wave and the next R wave • Dividethis number into 300
STEP 2: Heart Rhythm • Rhythm • Sequential beating of the heart as a result of the generation of electrical impulses
STEP 2: Heart Rhythm • Classified as • Regular pattern • Intervals between R waves are regular • Irregular pattern • Intervals between R waves are not regular
Regular Rhythm • Measure the intervals between P to P waves or R to R waves
Regular Rhythm • If the intervals vary by less than 0.06 seconds or 1.5 small boxes, we can consider the rhythm to be regular
Irregular Rhythm • If the intervals between the P to P waves or R to R waves are variable by greater than 0.06 seconds, rhythm is considered irregular • Regularly irregular • Irregular rhythms that occur in a pattern • Occasionally irregular • Intervals of only one or two R to R are uneven
Irregular Rhythm • If the intervals between the P to P waves or R to R waves are variable by greater than 0.06 seconds, rhythm is considered irregular • Irregularly irregular • R to R intervals exhibit no similarity
STEP 3: The P Wave • P wave is produced when the right and left atria depolarize • First deviation from the isoelectric line • Should be rounded and upright • P wave is SA node pacing or firing at regular intervals • This pattern is referred to as a sinusrhythm
P Wave: Five Questions to Ask • Step 1: Are P waves present? • Step 2: Are P waves occurring regularly? • Step 3: Is there one P wave present for each QRS complex present and/or is there a QRS for each P wave present?
P Wave: Five Questions to Ask • Step 4: Are the P waves smooth, rounded,and upright in appearance, or are they inverted? • Step 5: Do all P waves look similar?
STEP 4: The PR Interval • Measures the time interval from the onset of atrial contraction to onset of ventricular contraction • Measured from onset of P wave to the onset of the QRS complex • Normal interval is 0.12–0.20 seconds (3–5 small squares)
PR Interval: 3 Questions to Ask • Are PR intervals greater than 0.20 seconds? • Are PR intervals less than 0.12 seconds? • Are the PR intervals constant across the EKG strip?
STEP 5: The QRS Complex • Represents depolarization or contraction of the ventricles • Q wave • First negative or downward deflection of this large complex • R wave • First upward or positive deflection following the P wave (tallest waveform)
STEP 5: The QRS Complex • Represents depolarization or contraction of the ventricles • S wave • The sharp, negative, or downward deflection that follows the R wave
QRS Complex: 3 Questions to Ask • Are QRS intervals greater than 0.12 seconds (wide)? • Are QRS intervals less than 0.12 seconds (narrow)? • Are the QRS complexes similar in appearance across the EKG strip?
The ST Segment • Begins with the end of the QRS complex and ends with the onset of the T wave (consistent with isoelectric line) • J-point • Point at which the QRS complex meets the ST segment
The ST Segment • If ST segment is elevated or depressed, myocardial ischemia or injury may be indicated
The T Wave • Produced by ventricular repolarization or relaxation • Commonly seen as the first upward or positive deflection following the QRS complex
The U Wave • Usually not visible on EKG strips • Cause or origin not completely understood • Typically follows the T wave • Appears much smaller than T wave, rounded, upright, or positive deflection if they are present
Artifact • EKG waveforms from sources outside the heart
Artifact • Interference seen on a monitor or EKG strip • 4 causes • Patient movement • Loose or defective electrodes (fuzzy baseline) • Improper grounding (60 cycle interference) • Faulty EKG apparatus