Download
1 / 25
250 likes | 264 Vues
This study utilizes modeling techniques to support the development of nutrient TMDLs in Baltimore Harbor, a complex watershed with elevated nutrient levels. The modeling framework includes watershed modeling, hydrodynamic modeling, water quality modeling, sediment flux modeling, and more. The goal is to ensure water quality goals and resolve violations through effective management strategies.

E N D
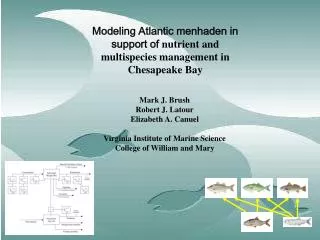
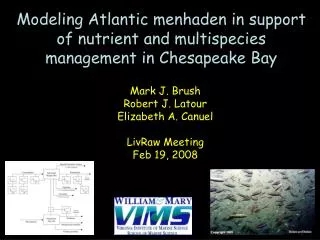
Modeling to Support the Development of Nutrient TMDLs in Baltimore Harbor Miao-Li Chang Maryland Department of the Environment
Acknowledgment Special thanks to the following individuals for data compilation, model setup/simulations, and document reviews: Nauth Panday, Dinorah Damalsy, Hui Liu and Dr. Harry Wang (Virginia Institute of Marine Science).
The watershed is home to 1.5 million people Landuse is predominantly industrial, commercial and residential (55 %) Watershed Characteristics
General Information There are more than 100 industrial facilities with wastewater or cooling water discharges to Baltimore Harbor The Baltimore Harbor is a very complex system with a unique 3-layer hydrodynamic flow pattern. The upper and lower layers flow inward to the head of the Harbor, and the middle layer flows outward. Spatially variable elevated levels of nutrients, metals and organics in water, sediments and bottom-feeding species of fish. This complexity necessitates a comprehensive monitoring and modeling program.
Harbor Eutrophication Modeling Framework • Watershed Model - HSPF • MDE Model used Patapsco/Back • CBP Model used for Upper Bay • Hydrodynamic Model - CH3D • Water Quality Model - CE-QUAL-ICM • Sediment Fluxes - Chesapeake Bay Sediment Flux Model • Consistent with CBP modeling framework for Tributary Strategy • Finer resolution and more local data for calibration
Watershed Model HSPF Hydrology (flow, TSS) Hydrodynamic Model CH3D Velocity, Diffusion, Surface Elevation, Salinity, Temperature Water Quality Model CE-QUAL-ICM Temperature, Salinity, Total Suspended Solid, Cyanobacteria/Diatoms/Algae, Carbon, Nitrogen, Phosphorus, COD, DO, Silica Watershed Model HSPF nutrients, sediments Sediment Diagenesis Model Sediment initial condition, Sediment settling rate Point Source and other loads Water Quality Prediction Harbor Eutrophication Modeling Framework
Point Source Locations PB1 = Back RiverPB2 = Eastern Stainless PP1 = CongoleumPP2 = Freedom District PP3 = ChemetalsPP4 = W.R. Grace PP5 = PatapscoPP6 = Cox Creek PP7-PP13 = Bethelehem Steel
Susquehanna River Choptank River Bush River Gunpowder River Bohemia River Back River Sassafras River Baltimore Harbor Magothy River Chester River Severn River South River CH3D - Curvilinear Hydrodynamic 3-dimension Velocity, Diffusion, Surface elevation, Salinity, Temperature on an intratidal time scale. Model physical processes impacting bay-wide circulation and vertical mixing Hydrodynamic Model
Water Quality Model • 22 state variables, 140 parameters • Temperature • Salinity • Total suspended solid • 3 algae groups : Dinoflagelete , Diatoms, Other (green) algae • Carbon cycle : DOC, LPOC, RPOC • Nitrogen cycle : Ammonium, Nitrate-nitrite, LPON, RPON • Phosphorus cycle : Total phosphate, DOP, LPOP, RPOP • Silica cycle : Available Silica, Particulate Biogenic Silica • COD • DO • CE-QUAL-ICM • Integrated compartment box model • Boxes correspond to cells in x-y-z space on the CH3D grid (3029 cells - 2 km 0.5 km 1.7 m in the surface plane, 8970 cells – 2 to 15 cells in the vertical) • Finite difference method using QUICKEST algorithm (Leonard, 1979) in the horizontal directions and a Crank-Nicolson scheme in the vertical direction • Kinetics are computed using a temporal dimension of days
Sediment Flux Model • WATER COLUMN Fluxes of O2, H2S, NH4, NO3, PO4, Si Depositional flux Diffusion Sedimentation ACTIVE SEDIMENT LAYER Aerobic layer POM Partioning Reactions Dissolved Particle mixing Dissolved mixing Anaerobic layer Partioning Reactions Diagenesis POM Dissolved Sedimentation Burial
WQ Calibration Baltimore Harbor • Algal bloom • Hypoxia/anoxia • Very eutrophication
Water Quality Data • Water column • MDE 94-95 • Baltimore City Department of Public Work 97 • Benthic flux • University of Maryland 94, 95, 97 • Upper Bay • Chesapeake Bay Program 82~
Technical Review Update • Reviewed by State Agencies, Baltimore County and Baltimore City • Reviewed by Chesapeake Bay Program Modeling Subcommittee • Reviewed by SAG Modeling Technical Group
Target TMDL water quality goals • Ensure that minimum DO concentrations specified for each designated use of the Baltimore Harbor are maintained; • Resolve violations of narrative Chla criteria. • MDE has determined, per Thomann and Mueller, that it is acceptable to maintain Chla concentrations below a maximum of 100 µg/L, and to target, with some flexibility depending on waterbody characteristics, a 30-day rolling average of approximately 50 µg/L.
Feb 1 –May 31 June 1 –Sept 30 Oct 1 –Jan 30 0 – Upper Pycnocline Migratory Fish (MF) Open Water (OW) Open Water (OW) Upper – Lower pycnocline Migratory Fish (MF) Deep Water (DW) Open Water (OW) Lower Pycnocline - Bottom Migratory Fish (MF) Deep Channel (DC) Open Water (OW) Designated Use 30-day mean 7-day mean 1-day mean Instantaneous minimum MF 5.0 OW 5.0 4.0 3.0 DW 3.0 2.3 1.7 DC 1.0 Baltimore Harbor Designated Uses and DO criterion
Solid Line = CBP Reference Curve Dotted Line = MDE Attainment Curve Percent Nonattainment = 2% Area blew the CBO Reference Curve representing an approximately 10 percent allowable exceedance equally distributed between time and space (CBP, 2003 DO Attainment Check
Sensitivity Scenarios • No Point Sources – 100% removal of point source loads in Harbor area: To test the impact of point sources. • No Nonpoint Sources -- 100% removal of nonpoint source loads in Harbor area: To test the impact of nonpoint sources. • No Anthropogenic Loads - 100% removal of point and nonpoint source loads: To test the impact of human activities (point + nonpoint source loads) • Clean Sediment -- Start model with clean sediment initially: To test the impact of internal source (pollutant loads from bottom sediments) • Bay Influences -- 100% removal of point and nonpoint source loads and start model with clean sediment initially: To test the impact of loads from Chesapeake Bay to Baltimore Harbor.
BALTIMORE HARBOR OTHER SCENARIOS LOADINGS and DO Attainment Check
Baltimore Harbor Possible TMDL Scenario Run Point Source : • Flow: Maximum permit flow • ENR to Municipal - TN: 4 mg/L annual average (3 mg/L in May - October, 5 mg/L in November - April), TP: 0.3 mg/L • Industrial PS – Best Possible Control loads Nonpoint Source: • 15 % reduction in controllable loads (urban storm water and agriculture loads)
Progress to Date • Model developments – Completed • Technical Review – Completed • Draft TMDL numbers – Completed • Plan: TMDL submittal in 2006