Download
1 / 18
180 likes | 329 Vues
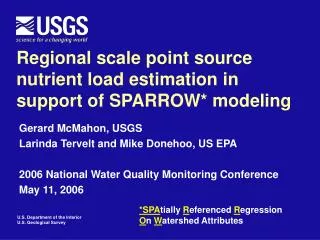
Regional scale point source nutrient load estimation in support of SPARROW* modeling. Gerard McMahon, USGS Larinda Tervelt and Mike Donehoo, US EPA 2006 National Water Quality Monitoring Conference May 11, 2006. *SPA tially R eferenced R egression O n W atershed Attributes.

E N D
Regional scale point source nutrient load estimation in support of SPARROW* modeling Gerard McMahon, USGS Larinda Tervelt and Mike Donehoo, US EPA 2006 National Water Quality Monitoring Conference May 11, 2006 *SPAtially Referenced Regression On Watershed Attributes
Summary of talk objectives How can PCS data be used to estimate annual, discharger-specific, point source nutrient loads across the southeastern United States? Summarize results of load estimation. Identify several take home messages about undertaking a similar project in the future. National Water Quality Assessment Program
What kinds of point source data are needed for the SPARROW model?
SPARROW model approach:Regress monitored load against variables characterizing sources, overland transport and instream transport Sources Overland transport Monitored load
How can PCS data be used to estimate annual, discharger-specific nutrient loads across the southeastern United States? • Data availability • Methodology overview • Data preparation • Load calculation
Where do we get data? • How are point source discharge data generated? • Decisions that focused the data development effort. • How many dischargers?
Methodology overview • Overall concept similar to EPA Miss. R. point source nutrient load project (1998) • 4-step load estimation process for southeastern U.S.
Prepare data for load calculations • Prepare single flow value. • Prepare single TN and TP concentration value • Discharger specific • Typical pollutant concentration – SE region • Typical pollutant concentration – National
What is allocation of PCS/state flow data between major and minor dischargers?
Calculate loads • Load calculation approach • Three load calculation scenarios • 12-months of flow data • Flow data during 3 or 4 quarters, but less than 12 months. • Flow data during less than 3 quarters
What is allocation of TN and TP load between major and minor dischargers?
What is allocation of TN and TP load by size of receiving streams?
What are the primary sources of TN and TP load, in terms of SIC code?
What is the allocation of TN and TP load from sewerage treatment plants by size of discharges?
Conclusions • Success in a census approach to calculating annual nutrient loads from point source dischargers across a large region is dependant on several factors. • The load results to date highlight several lessons important to modelers. • Need exists for long-term cooperative approach involving state and federal agencies to generate annual nutrient loads for the entire country using uniform procedures and assumptions.