Download
1 / 22
220 likes | 386 Vues
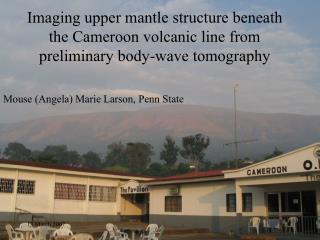
Imaging upper mantle structure beneath the Cameroon volcanic line from preliminary body-wave tomography. Mouse (Angela) Marie Larson, Penn State. Co-authors and field team: Andy Nyblade, Penn State Doug Wiens, Washington University Rigobert Tibi, Washington University

E N D
Imaging upper mantle structure beneath the Cameroon volcanic line from preliminary body-wave tomography Mouse (Angela) Marie Larson, Penn State
Co-authors and field team: • Andy Nyblade, Penn State • Doug Wiens, Washington University • Rigobert Tibi, Washington University • Patrick Shore, Washington University • Garrett Euler, Washington University • Yongcheol Park, Penn State • Bekoa Ateba, IRGM Cameroon • Joseph Nnange, IRGM Cameroon • Charles Tabod, University of Yaounde Cameroon • Alain Tokam, University of Yaounde Cameroon • Funding from NSF & Kenneth N. Weaver Travel Award Program (NEGSA) - thanks!!!
Talk outline • Cameroon background • The seismic experiment • Seismic tomography • Results • What next
Cameroon Volcanic Line (CVL) • ~1500km line of volcanics • 30Ma to present • Active volcanism in center • No age progression • (like traditional hotspot traces)
CVL origin models • Single plume model • Multiple plumes • African superplume • Edge flow convection • Leaky transform • Wikipedia says…
Cameroon Seismic Experiment 32 broadband stations STS-2 and Guralp seismometers 32-bit Reftek data loggers Station spacing ~75km
Body-wave tomography • Similar to CT scans and ultrasounds in hospitals • We choose where receivers are placed • Earthquakes are the sources (so we have no control over frequency, number, distribution, size, etc)
Tomography steps • Events Mb>5.0 • Distance range 30-90 degrees • Filter and pick P arrivals • Multi-channel cross correlation technique (VanDecar 1991) calculates relative travel time residuals • Inverse modeling to find best model that fits the data
Current dataset • About three months of data (out of potential 24 months) • 63 events • ~1100 rays
What next? • Add in the remaining dataset (should increase the number of rays >5times) • Add in PKP rays to improve azimuthal coverage • Generate S-wave models using S and SKS arrivals • Determine the best inversion parameters (trade-offs between resolution and fit) • Run resolution test to evaluate strengths and weaknesses of the dataset
Thanks! Questions?