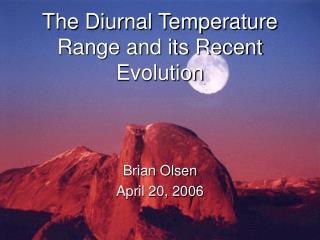
The Diurnal Temperature Range and its Recent Evolution
140 likes | 259 Vues
This document explores the concept of Diurnal Temperature Range (DTR), defined as the difference between high and low temperatures within a 24-hour period. It examines local examples and global trends from 1950 to 2004, highlighting the warming signal and recent unique trends, including a "pause" in global warming. The relationship between urban heat islands, climate variables, and DTR is analyzed, with a focus on how minimum temperatures have increased disproportionately to maximums, leading to a decrease in DTR. The report emphasizes the challenges in measuring DTR trends amidst local and global variability.

The Diurnal Temperature Range and its Recent Evolution
E N D
Presentation Transcript
The Diurnal Temperature Range and its Recent Evolution Brian Olsen April 20, 2006
Outline • Introduction to DTR • Local Examples • Global Trends • What affects DTR? • Conclusions
The Global Warming Signal Multi-decadal “pause” in warming IPCC, 2001
Diurnal Temperature Range (DTR) • DTR = High - Low • High Temperature = 81F • Low Temperature = 58 F • DTR = 81 F – 58 F =23 F Lowest in winter Highest insummer SLC WFO
KSLC Trends Warming? Definite Warming! E. Crossman • But why? • What about a nearby rural location?
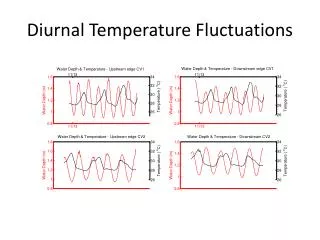
KENV Monthly Mean of Daily Tmax, Tmin, and DTR (1913-2004) General loss of warm colors in summer Missing data General gain of cool colors in winter B. Olsen
KENV Trends • Tmax actually decreases • Tmin increases • DTR decreases But where did the trend go? • Obviously, this is a complicated problem Pause in warming B. Olsen
Global Trends(1950 - 2004) StrongWarming Steady StrongWarming Warming Decreasing Steady Vose et al. 2005 Vose et al. 2005
< ≈ 1950 – 2004 1979 - 2004 GreatestWarming GreatestWarming Vose et al. 2005
Global Trends(1979 – 2004) Trendless Vose et al. 2005 Vose et al. 2005
Correlation Coefficient Why? What Affects DTR? • Urban Heat Island (increase minimums) – local effect • Irrigation & Desertification not globally significant – local effect • Climate variables • Cloud coverage and altitudeexplain ~40% of variance • All vars ~55% of variance • Other considerations • Jet Contrails (Travis et al. 2004) • Tropospheric aerosol • GHG emissions Karl et al. 1993
Conclusions • The planet is warming • The planet is getting less cool • Historically, minimum temps increased more than maximum temps => decrease in DTR • Winter / Spring warmed the most • Rate of warming has increased since 1980 • Recently, minimum temps and maximum temps rise in step => no trend in DTR • Winter continues to become more mild • Signal most apparent in Northern Hemisphere • Cloud cover is significant
(In)Conclusions • DTR trend is difficult to measure • difference between two large quantities • Noisy / lots of temporal variability • Wide regional variation • Global generalizations may be a poor measure • Local effects may overpower global trend • Model / Observation discrepancy