Download
1 / 19
200 likes | 312 Vues
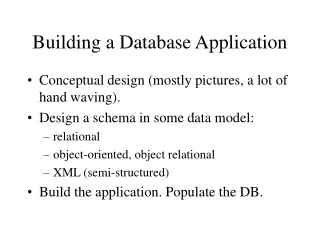
Building a Multi-Year Database of AAG Conference Abstracts. André Skupin / Shujing Shu Dept. of Geography / Dept. of Computer Science University of New Orleans. Knowledge Domain Visualization. Why? understand knowledge domains in terms of: Past how did this research area develop?

E N D
Building a Multi-Year Database of AAG Conference Abstracts André Skupin / Shujing Shu Dept. of Geography / Dept. of Computer Science University of New Orleans
Knowledge Domain Visualization • Why? • understand knowledge domains in terms of: • Past how did this research area develop? • Present who are the leading researchers and topics? • Future what will have high priority for federal funding? • Who are the users? • non-specialists: • teaching tool • specialists: • find trends, emerging topics, potential collaborators • b/w specialists from different domains: • enable communication about knowledge domains • funding agencies • research impact analysis
Knowledge Domain Visualization Example: domain experts
Knowledge Domain Visualization • Geographic/Cartographic/GIScience Perspectives on: • Metaphors • map, landscape • Technology • GIS • Methods • objects vs. fields • visualizing change • Challenges • computation • cognition
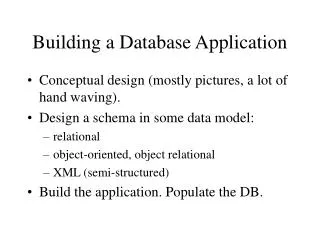
AAG abstracts 1993 – 2002from unstructured to structured data • Issues: • parse documents • begin/end • parse document components • metadata • author name, address, email • content • title, abstract text, keywords • variations in format between years • variations in format within years • author disambiguation
AAG abstracts 1993 – 2002from unstructured to structured data
AAG abstracts 1993 – 2002interesting facts • abstracts: 22,089 • authors: 30,589 • unique authors: ~ 13,521 • disambiguation of author names difficult • same authors counted more than once • “Andre Skupin” versus “André Skupin” • multiple authors with same name • “Michael Smith” versus “Michael Smith” • max authors for one abstract: 17 • Knight et al. (1999) A framework for integrated regional assessment of global climate change. (Penn State) • max abstracts for one author: 29 • Kam-biu Liu, Louisiana State University
AAG Meeting 1992 – 2003: Term Dom. Landscape + Neuron Label Clusters
AAG Meeting 1992 – 2003: Term Dom. Landscape + Neuron Label Clusters
NAS Workshop on Uncertainty Visualization: 3 sessions w/ 3-4 speakers + 1 discussant
2005 AAG Meeting: Sessions on “Mapping Humanity’s Knowledge in the Digital Domain”
Author Change Surface – Michael Goodchild 1970 - 1979 1975 - 1984 [’75-’84] minus [’70-’79]
Author Change Surface – Michael Goodchild 1980 - 1989 1985 - 1994 [’85-’94] minus [’80-’89]
AAG Abstract Database – Future Work • Tool development and deployment • AbstractMap System • AbstractMap Manager • AbstractMap Viewer • scalability to large data sets? • Tool application • time / geographic space / attribute space • cluster emergence/growth/abandonment • disciplinary evolution • institutional evolution • author trajectories • links between conference site and topics • integrate across disciplines • map of science