Malnutrition and Obesity
570 likes | 1.12k Vues
Malnutrition and Obesity. Whitney Hegedus MS RD CSO LDN CNSC St. Jude Children’s Research Hospital. Objective. The Learner will… Understand the definition of malnutrition Understand how obesity is defined Understand the prevalence of obesity in the United States

Malnutrition and Obesity
E N D
Presentation Transcript
Malnutrition and Obesity Whitney Hegedus MS RD CSO LDN CNSC St. Jude Children’s Research Hospital
Objective • The Learner will… • Understand the definition of malnutrition • Understand how obesity is defined • Understand the prevalence of obesity in the United States • Understand potential micronutrient deficiencies among the obese population
What Is Obesity A life-long, progressive, life-threatening, costly, genetically related, multi-factorial disease of excess fat storage with multiple co-morbidities ASMBS.org
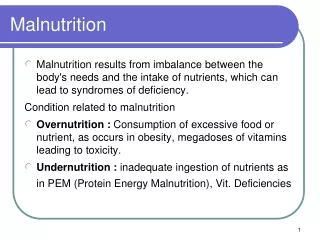
Malnutrition • Any disorder of nutrition status including disorders resulting from a deficiency of nutrient intake, impaired nutrient metabolism or over nutrition • Therefore obesity is a form of malnutrition ASPEN – Board of Directors and Standards Committee
Malnutrition Historically, thought that micronutrient deficiencies were rare in Western countries because of the relatively low cost and ample food supply Many people consume food that is of poor nutritional quality however high in calories, fat, salt and/or sugar Kaidar-Person O, Person B, Szomstein S, Rosenthal RJ. Nutrition deficiencies in morbidly obese patients: a new form of malnutrition? Part A: Vitamins. Obes Surg; 2008:18:870-976.
Measuring Obesity • Determined by height and weight • Body Mass Index (BMI) BMI = weight (kg)_____ height (m) x height (m)
BMI Chart < 18.5 Underweight 18.5-24.9 Healthy Weight 25.0-29.9 Overweight 30.0-34.9 Class I Obesity 35.0-39.9 Class II Obesity >40.0 Class III Obesity (Morbid Obesity)
BMI to Weight Examples A person 65” would have the following BMIs Weight (lbs) BMI (kg/m2) Classification 105 17 Underweight 130 22 Healthy Wt 165 27 Overweight 195 32 Obesity I 235 37 Obesity II 265 44 Obesity III
Prevalence and Trends in Obesity Among US Adults 2009-2010 • 69.2% American adults are considered overweight (BMI >25) • 35.9% considered obese (BMI >30) • 6.3% considered morbidly obese (BMI >40) • When compared to the 2003-2008 data there is no significant change in the prevalence of obesity; however all percentages did increase Flegal KM, Caroll MD, Kit BK, Ogden CL. Prevalence of obesity and trends in the distribution of body mass index amount US adults, 1999-2010. JAMA. 2012;307(5):doi:10.1001/jama.2012.39.
Prevalence of High Body Mass Index in US Children and Adolescents, 2009-2010Ages 2-19 for both sexes and all ethnicities • 31.8% considered overweight • BMI >85th percentile on CDC BMI Growth Charts • 16.9% considered obese • BMI >95th percentile on CDC BMI Growth Charts • 12.3% of children and adolescents have a BMI >97th percentile Ogden CL, Caroll MD, Kit BK, Flegal KM. Prevalence of obesity and trends in body mass index among US children and adolescents, 1999-2010. JAMA. 2012;307(5):dio:10.1001/jama.2012.40.
Leading Cause of Death • CDC announced in 2004 that unless current trends are reversed poor diet and physical inactivity will soon become the leading cause of death in America
Actual Cause of Death • In 2000 • 435,000 deaths attributed to smoking (18.1%) • 400,000 deaths attributed to poor diet and physical inactivity (16.6%) Mokdad AH, Marks JS, Stroup DF, Gerberding JL. Actual Causes of Death in the United States, 2000. JAMA. 2004;291:1238-1245.
Prevalence and Trends in Obesity Among US Adults 2009-2010 • 69.2% American adults are considered overweight (BMI >25) • 35.9% considered obese (BMI >30) • 6.3% considered morbidly obese (BMI >40) • When compared to the 2003-2008 data there is no significant change in the prevalence of obesity; however all percentages did increase Flegal KM, Caroll MD, Kit BK, Ogden CL. Prevalence of obesity and trends in the distribution of body mass index amount US adults, 1999-2010. JAMA. 2012;307(5):doi:10.1001/jama.2012.39.
Original Question If obesity is a form of malnutrition, what excesses or deficiencies should be evaluated, monitored and/or treated? Most research reporting micronutrient deficiencies in obese patients are the result of presurgical evaluations of bariatric patients
Study 1 Aim to assess concentrations of vitamins A, B1, B2, B6, folate, B12, C, D and E in morbidly obese patients compared to the concentrations in a healthy control group Aasheim ET, Hofso D, Hjelmesaeth J, Birkeland KI, Bohmer T. Vitamin status in morbidly obese patients: a cross-sectional study. Am J Clin Nutr. 2008;87:362-9.
Vitamin Concentrations in Morbidly Obese Patients and Healthy Controls
Results Significant differences were noticed in 6 out of the 9 vitamins examined Obese patients had significantly lower mean serum concentrations of vitamins A, B6, C, D and lipid standardized vitamin E A range of 11-38% of obese patients were considered to have inadequate vitamin B6, C, D and lipid standardized vitamin E The obese patients had a higher concentration of B1 compared to the healthy control group
Conclusion Morbidly obese Norwegian patients may have lower circulating concentrations of several vitamins including vitamin B6, C, D and lipid-standardized vitamin E
Study 2 Study design was to investigate the vitamin and trace mineral levels of patients before and after laparoscopic gastric bypass Madan AK, Orth WS, Tichansky DS, Ternovits CA. Vitamin and trace mineral levels after laparoscopic gastric bypass. Obes Surg. 2006; 16:603-606.
Discussion Having excess weight does not imply appropriate vitamin and trace mineral levels Poor nutrition habits of morbidly obese patients may make them more susceptible to lower levels of vitamins and minerals
Conclusions Consideration should be given to testing vitamin and trace minerals on any morbidly obese patients Other paper conclusions were specific to gastric bypass surgery