Download
1 / 59
590 likes | 710 Vues
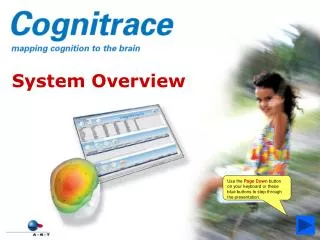
System Overview. Use the Page Down button on your keyboard or these blue buttons to step through the presentation. System Overview. Patient Management Recording Analysis Reporting. Patient Management.

E N D
System Overview Use the Page Down button on your keyboard or these blue buttons to step through the presentation.
System Overview • Patient Management • Recording • Analysis • Reporting
When Cognitrace starts the patient management database is opened automatically. From here you can manage patients, review recordings, analyze data and build reports. The patient management database includes tools for searching through records and archiving data to CD or DVD. Intuitive icons let you navigate the data.
The top pane shows Patients. The table can be sorted on each of the fields, i.e. last name, first name, patient ID etc. Search forms are available to quickly find patients. Patient information is not restricted to the above shown fields, information related to medication, diagnosis, address information or other text fields can be included as well.
The middle pane shows the Recordings for the selected patient. The table can be sorted on each of the fields, i.e. date of recording, type of recording, name of technician etc. Search forms are available to quickly find those recordings that were done in the previous week, months etc.
The lower pane shows Studies. Studies are all the analysis results and reports that were generated for a certain recording. The table can be sorted on each of the fields, i.e. type of analysis, finished yes/no, notes etc. Search forms are available to locate all studies that were not finished yet.
By clicking the Control pane button a small window appears on the left of the screen that allows the user to search the patient database (so-called queries) and to perform archiving.
Control Pane: Performing queries using filters Patients, Recordings and Studies can be filtered in order to select a subset of them. (for instance, the letter b can be entered in the Patient field, which selects from the list of patients only those of whom the last name starts with b) Unfinished studies and recent recordings can be selected quickly for review and archiving.
Control Pane: Archiving Archiving of data is accomplished by selecting the Archive tab in the control pane. Here you can export data that you selected via a filter to CD, DVD, HD or local network. Cognitrace archives all data that was selected by the data filter. Archiving is done within cognitrace and the progress tab shows the completion of the process.
Via this check box it is also possible to define which data will be archived.
Control Pane: Import / View Data can be imported into the patient database by selecting the Import option. With View a temporary database is generated that allows the technician to review data without having to import the data completely.
Clicking the New or Editpatient buttons allows the user to enter new patient information.
Patient information is not restricted to the shown fields, information related to medi- cation, diagnosis, address or other text fields can be included as well. New Patient Form Edit patient information form
New recordings are started by clicking the New recording button and by selecting one of the templates from the new recording dialogue. The recording is automatically initialized and opens a new window.
New recording dialogue: The drop down list next to templates allows selection of different recording templates (protocols). Notes can be added to facilitate data identification on later occasion.
After clicking the check mark of the new recording dialogue a connection to the amplifier is made and the program starts showing the data as it comes in. Data is not stored at this moment.
The panel on the lower left shows the protocol of the recording. It includes different steps such as patient preparation (impedance check) and different stimulation sessions. A red dot next to a step indicates that it is mandatory. Steps without it can be skipped.
The upper left panel shows information for each of the steps in the protocol and guides the user through the recording protocol. Clicking >> and << allows the user to step forward and backward in the protocol.
First thing to do is to check impedance and make sure each electrode makes a good connection to the scalp. Impedances should be lower than 50k Ohm for high-quality recordings. By clicking the Impedance check button the program automatically switches to impedance view.
Impedance view A colour at each electrode defines the level of impedance, blue being a good, red being a poor connection to the scalp. All channels are shown in head layout to allow easy navigation on the cap.
After the impedance has been checked the user switches back to EEG preview. The quality of the EEG can be checked visually. The user can always return to Impedance check to access the impedances. Impedance values are stored at the beginning in the raw data and can be reviewed off line.
The user should click >> to continue with the protocol of recording.
The next step in this protocol consists of recording sessions of continuous EEG with eyes closed, eyes open and hyperventilation. The following slides explain all the sessions in this recording protocol in more detail.
Eyes closed During the eyes closed session continuous EEG is recorded and markers are placed in the EEG to denote the type of session and the number of the run (EC_1 = First Eyes Closed run). The Start Eyes Closed button starts the recording, Pause allows the technician to pause the recording, Stop Eyes Closed terminates this session and allows the user to continue with the next. The timer starts counting automatically when the session is started and keeps track of the total session time so far. Data is epoched in 2s intervals for the spectral analysis processing after the recording. EC_1 EC_1 EC_1 EC_1 EC_1 EC_1 EC_1 2s epochs
Eyes open During the eyes open session continuous EEG is recorded and markers are placed in the EEG to denote the type of session and the number of the run (EO_1 = First Eyes Open run). The Start Eyes Open button starts the recording, Pause allows the technician to pause the recording, Stop Eyes Open terminates this session and allows the user to continue with the next. The timer starts counting automatically when the session is started and keeps track of the total session time so far. Data is epoched in 2s intervals for the spectral analysis processing after the recording. EO_1 EO_1 EO_1 EO_1 EO_1 EO_1 EO_1 2s epochs
Visual Evoked Potential (VEP) Recording of the brain response during stimulation with a photic flash. Start, Stop and Pause buttons are available to control the recording of the VEP’s. Again multiple runs can be recorded and make it possible to switch between different types of recording sessions (i.e. between VEP and AEP etc). VEP_1 VEP_1 VEP_1 VEP_1 VEP_1 VEP_1 VEP_1 1s ISI
Auditory Evoked Potential (AEP) Recording of brain responses evoked by 1000 Hz tones that are presented at 1 second interval. Start, Stop and Pause buttons are available to control the recording of the AEP’s. Again multiple runs can be recorded and make it possible to switch between different types of recording sessions (i.e. between AEP and VEP etc). AEP_1 AEP_1 AEP_1 AEP_1 AEP_1 AEP_1 AEP_1 1 seconds ISI
Auditory Oddball Paradigm (P300 auditory) Recording of brain responses to the stimulation of two different tones; a frequent (1000Hz) and rare (2000Hz) one. These tones are presented pseudo-random with a 80/20 likelihood ratio. Start, Stop and Pause buttons are available to control the recording. The timer keeps track of the recording time in this run. Multiple runs of P3 can be recorded and make it possible to switch between different types of recording sessions. freq_1 freq_1 rare_1 freq_1 rare_1 freq_1 freq_1 1 seconds ISI
Analysis Auditory Evoked Potential
Analysis Analysis of a recording is started by selecting a recording and then clicking the New button below Studies.
The preferred template for analysis can be selected from a drop-down list and the check mark button is clicked to start the analysis.
The analysis template is opened and some pre-processing steps (like filtering and artefact detection) are performed automatically.
Once these pre-processing steps are finished (takes about 5s), the data and the protocol of analysis is presented.
Event List Detected artefacts in pink AEP_1 events
Artefacts that were missed by the automatic detection algorithm can be added manually by clicking the artefact event button. The artefact will then be marked and excluded from the rest of the analysis.
Events and Channels can also be selected easily by dragging the mouse over the corresponding EEG event or channel. The corresponding event is automatically highlighted in the event list to allow the user to enable (check mark) or disable (cross) it.
Once the data is reviewed and artefacts are marked, >>should be clicked. Data is averaged and presented.
The averages are shown in maps and as traces. The blue, black and red traces correspond to three runs of AEP that were collected. At this stage the users can decide which of the runs should be included in the grand average.
Patient Reference data Age-matched reference data is loaded and presented together with the patient AEP traces. The maps on the right show the AEP maps together with statistical difference (based on z-score) at a certain latency. z-score
After reviewing of the statistical maps the report is automatically generated and shows all the snapshots that could be taken during the analysis steps. Extra comments can be added. The report is stored automatically in the database and can be opened on later occasions.
Analysis Spectral analysis of Eyes Closed EEG
The spectral analysis of continuous EEG from eyes closed and eyes open sessions, works similar to the AEP analysis. First, in a pre-processing phase filtering and artefact detection is done, followed by a stage where the user is able to manually review the data. Again, snapshots can be taken from the data and included in the report.
After review of data, for each 2s epoch the FFT spectra are calculated and an average across these FFT spectra is made. The result is presented with a spectrum for each of the channels. The colours in the spectra mark the different frequency bands that were configured by the user.
Patient Reference data Age-matched reference data is loaded and presented together with the FFT maps of the patient. Statistical maps are shown as well. z-score Frequency Bands (theta, delta, alpha, beta)
Reference data Patient z-score FFT maps for one frequency band (alpha).
In the report of spectral analysis comments can be entered. The report can be printed and is saved in the patient database.