Download
1 / 30
300 likes | 421 Vues
This paper analyzes mortality rates in Sweden from 1861 to 2009, utilizing both cohort and period perspectives. It highlights the significance of age, sex, and historical trends in mortality rates, with a focus on the declining male mortality rates compared to females. The study discusses the effectiveness of the Lee-Carter model in projecting future mortality trends and emphasizes the need for new models that incorporate gender-specific factors. The findings underscore the smooth and gradual nature of mortality changes over time, while calling for further research into mortality predictors.

E N D
Cohort and Period Mortality in Sweden A nearly 150 year perspective and projection strategiesHans LundströmStatistics SwedenJoint Eurostat/UNECE Work Session on Demographic Projections Lisbon, 28-30 April 2010
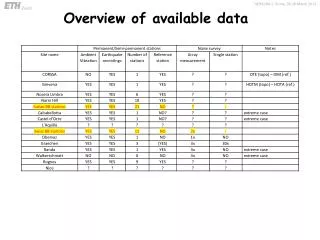
Available mortality data • Mortality rates by sex in one year age classes • 1861 to 2009 • Age is calculated based on registered data • Quality of data is high
Female mortality Age 30-100 Apart from stochastic fluctuations mortality rate is closely related to mortality rate for next higher/lower age and to mortality rate in preceding/following year. Stable pattern
Male mortality Age 30-100
Females Males Mortality show a smooth and gradual change over time and age.
Mortality projection To sum it all up: • The Lee-Carter model for the last 15 to 20 years fits nicely to male and female mortality
Problem • Male mortality is declining more rapidly then female mortality • Lee-Carter method results in a cross-over after some years • Is a situation with lower mortality for males than for females likely?
Male excess mortality for nearly all ages and years 1861-2008 Age 1861 1950 2008 0 100
Using Lee-Carter Age-Period model the projection results in lower mortality for males than for females in a 30 year perspective Likely?
A new model is needed • To the two-factor model Age & Period • we must add Sex to the model
An observation .. A more rapid mortality decline for females started in the 1950s. For males we had a 30 year lag before mortality started to decline. Present rate of progress for males similar to that for females in the 1950s
Male mortality shifted back 30 years in time for ages 40,50,60,70, 80 and 90
The cohort perspective Mortality show a smooth and gradual change over time and age in a cohort perspective too
Female mortality. Cohorts 1770-2005 For ages above 50 nearly parallell shift of mortality curve from one cohort to the next.
A new model is needed • So far we have used the Lee-Carter Age & Period model • The Lee-Carter model has lately been extended to incorporate cohort effects too. This model is worth a closer look • Probably we still have to add Sex as a fourth factor to the model
Alternative future approach • We must gain better insight into the causes and predictors of mortality • For that we must know the ”risk profile” for cohorts and know the relationship between”risk factors” and mortality • Much remains to be done • A first step is look into cohort cause-of-death data
A cohort-based extension to the Lee–Carter model for mortality reduction factors. A.E. Renshaw, S. Haberman Cass Business School, City University, London, EC1Y 8TZ, UK Abstract The Lee–Carter modelling framework is extended through the introduction of a wider class of generalised, parametric, non-linear models. This permits the modelling and extrapolation of age-specific cohort effects as well as the more familiar age-specific period effects. The choice of error distribution is generalised. Insurance: Mathematics and Economics 38 (2006) 556–570
Cohort mortality in Sweden - Mortality statistics since 1861 http://www.scb.se/Pages/PublishingCalendarViewInfo____259924.aspx?PublObjId=12788 Cohort life tables in Excel format: http://www.scb.se/Pages/ProductTables____55370.aspx The future population of Sweden 2009-2060 publication http://www.scb.se/Pages/PublishingCalendarViewInfo____259924.aspx?PublObjId=11386 The future population of Sweden 2010-2060 publication http://www.scb.se/Pages/PublishingCalendarViewInfo____259924.aspx?PublObjId=11928