Broken Arrow Public Schools State Testing Update 2008-09
330 likes | 499 Vues
Broken Arrow Public Schools State Testing Update 2008-09. Student Groups. All Students Regular Education Students Black American Indian Hispanic Asian White Other Economically Disadvantaged English Language Learners (ELL) Students with Individualized Education Programs (IEP).

Broken Arrow Public Schools State Testing Update 2008-09
E N D
Presentation Transcript
Broken Arrow Public Schools State Testing Update 2008-09
Student Groups • All Students • Regular Education Students • Black • American Indian • Hispanic • Asian • White • Other • Economically Disadvantaged • English Language Learners (ELL) • Students with Individualized Education Programs (IEP)
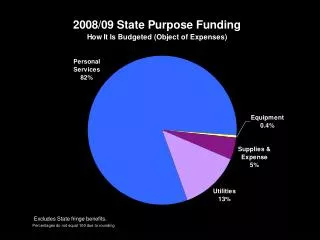
API Point Contributions for Elementary and Middle Schools 10% 90%
API Point Contributions for High Schools 80% 10% 10%
OCCT General Assessments for Grades 3 – 8 (2009) Federal and State mandated tests: results used in accountability calculations Federal and State mandated tests State mandated tests
Standards Raised for State Testing Program • The SDE approved more rigorous standards for 3-8th grade math and reading students. • Raised the bar for determining success • “CUT SCORES” were increased • Aligned proficiency levels closer to NAEP • Math and reading scores declined statewide • The new standards will be used to determine API and AYP beginning this school year.
% Proficient (Reg. Ed.) 2004-05 to 2008-09 3rd Grade CRT Trend
% Proficient (Reg. Ed.) 2004-05 to 2008-09 3rd Grade CRT Trend
% Proficient (Reg. Ed.) 2004-05 to 2008-09 BAPS 4th Grade CRT Trend
% Proficient (Reg. Ed.) 2001-02 to 2008-09 5th Grade CRT Trend
% Proficient (Reg. Ed.) 2005-06 to 2008-09 6th Grade CRT Trend
% Proficient (Reg. Ed.) 2005-06 to 2008-09 7th Grade CRT Trend
% Proficient (Reg. Ed.) 2001-02 to 2008-09 8th Grade CRT Trend
State Testing Highlights: 2008-09 • 5th grade • Science…2nd highest score (tied) since 2001-02 • Social Studies…2nd highest score since 2001-02 • Writing…highest score since 2001-02 • 8th grade • Science…highest score since 2001-02 • U.S. History…2nd highest score since 2001-02 • Writing…highest score (tied) since 2001-02
OCCT General Assessments for End-of-Instruction (2008-2009) Federal and State mandated tests: results used in accountability calculations Federal and State mandated test State mandated tests
State Testing Highlights: 2008-09 • End-of-Instruction • Algebra I…highest score since testing began in 2002-03 • Algebra II…highest score (+17%) during the two years of state testing • Geometry…tied for highest score during two years of testing • English II…highest score (tie) since 2000-01 • English III…highest score during two years of state testing • Biology I…highest score (+15%) since 2002-03 • U.S. History…2nd highest score (tied) since 2000-01
Community Group • Broken Arrow • Edmond • Lawton • Moore • Norman • Putnam City • Union
Non-proficient CRT population: 2007-08 vs 2008-09 (“All Students” FAY/NFAY) • 3rd Reading: 108/307 • 3rd Math: 171/326 • 4th Math: 92/232 • 4th Reading: 56/269 • 5th Math: 80/273 • 5th Reading: 149/286 • 6th Math: 159/359 • 6th Reading: 209/350 • 7th Math: 172/335 • 7th Reading: 233/314 • 8th Math: 107/345 • 8th Reading: 120/225
Non-proficient EOI population: 2007-08 vs 2008-09 (“All Students” FAY/NFAY) • Algebra I: 169/125 • English II: 201/140 • English III: 149/180 • Algebra II: 326/186 • U.S. History: 335/236 • Geometry: 210/206 • Biology I: 450/216