Download
1 / 26
260 likes | 408 Vues
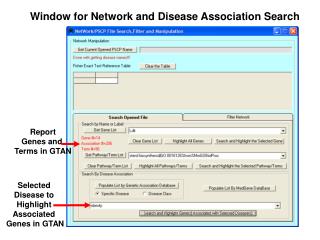
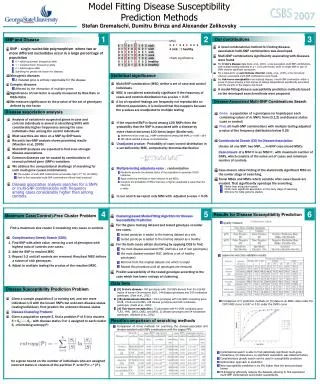
Combinatorial Methods for Disease Association Search and Susceptibility Prediction. Alexander Zelikovsky joint work with Dumitru Brinza Department of Computer Science. Outline. SNPs, Haplotypes and Genotypes Disease Association Search Genome-wide association search challenges

E N D
Combinatorial Methods for Disease Association Search and Susceptibility Prediction Alexander Zelikovsky joint work with Dumitru Brinza Department of Computer Science
Outline • SNPs, Haplotypes and Genotypes • Disease Association Search • Genome-wide association search challenges • Problem formulation • Exhaustive & Combinatorial Search • Optimization formulation & complimentary greedy search • Predicting susceptibility to complex diseases • Problem formulation/cross-validation • Previous methods: SVM, RF, LP • Optimum clustering and prediction via model-fitting • Conclusions
SNP, Haplotypes, Genotypes • Length of Human Genome 3 109 • #Single nucleotide polymorphism (SNPs) 1 107 • SNPs are mostly biallelic, e.g., AC • Minor allele frequency should be considerable e.g. >.1% • Difference b/w ALL people 0.25% (b/w any 2 0.1%) • Diploid = two different copies of each chromosome • Haplotype = description of a single copy (expensive) • example: 00110101 (0 is for major, 1 is for minor allele) • Genotype = description of the mixed two copies • example 01122110 (0=00, 1=11, 2=01) • International Hapmap project: www.hapmap.org
Challenges of Disease Association • Monogenic disease • A mutated gene is entirely responsible for the disease . • Typically rare in population: < 0.1%. • Complex disease • Interaction of multiple genes • 2-SNP interaction analysis for a genome-wide scan with 1 million SNPs (3 kb coverage) has 1012 pairwise tests • Multiple independent causes • Each cause explains < 10-20% of cases • Common: > 0.1%. • In NY city, 12% of the population has Type 2 Diabetes • Multiple testing adjustment • Reason for non-reproducible findings
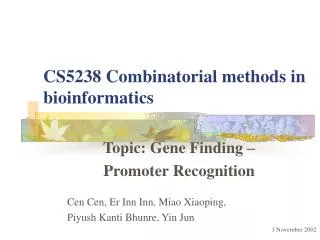
Disease Association Search Problem Disease Status SNPs -1 -1 -1 -1 1 1 1 1 0101201020102210 0220110210120021 0200120012221110 0020011002212101 1101202020100110 0120120010100011 0210220002021112 0021011000212120 Non-diseased genotypes: H • Sample population S of individual genotypes • Risk/resistance factor = multi-SNP combination (MSC) • a subset ofSNP-columns of S • the values of these SNPs, 0, 1, or2 • Cluster C= subset of S with an MSC, • d(C) = diseased, h(C) = non-diseased • PROBLEM: Find all MSCs significantly associated with the disease Diseased genotypes: D
Significance of Risk/Resistance Factors • Measured by • Relative risk (RR) • Odds ratio (OR) • Their p-values • Unadjusted p-value: Probability of case/control distribution among exposed to risk factor, computed by binomial distribution • Multiple-testing adjustement: • Bonferroni • easy to compute • overly conservative • Randomization • computationally expensive • more accurate
Exhaustive & Combinatorial Search • Exhaustive search is infeasible • sample with n genotypes/m SNPs requires O(n3m) • Combinatorial search Definition: Disease-closure of a multi-SNP combination C is a multi-SNP combination C’, with maximum number of SNPs, which consists of the same set of disease individuals and minimum number of nondisease individuals. • Searches only closed clusters • Closure of cluster C = C’ • d(C’)=d(C) and h(C’) is minimized • Avoids checking of trivial MSCs • Small d(C) implies not looking in subclusters • Finds faster associated MSCs but still too slow • Tagging: • compress S by extracting most informative SNPs • restore other SNPs from tag SNPs • multiple regression method
MLR Tagging • Stepwise Index SNP Algorithm: • Choose as a tag the SNP which best predicts all other SNPs • Choose the next one which together with a first best predicts all other SNPs and so on. • Prediction method is based on Multiple Linear Regression (MLR) • So far beats in quality other methods (STAMPA)
Data Sets • Crohn's disease (Daly et al ): inflammatory bowel disease (IBD). Location: 5q31 Number of SNPs: 103 Population Size: 387 case: 144 control: 243 • Autoimmune disorders (Ueda et al) : Location: containing gene CD28, CTLA4 and ICONS Number of SNPs: 108 Population Size: 1024 case: 378 control: 646 • Tick-borne encephalitis dataset of (Barkash et al) : Location: containing gene TLR3, PKR, OAS1, OAS2, and OAS3. Number of SNPs: 41 Population Size: 75 case: 21 control: 54
Disease association search results • IES(30): • exhaustive search • 30 indexed SNPs with MLR based tagging method • ICS(30): • combinatorial search • 30 indexed SNPs with MLR based tagging method.
Disease Association Search • Optimum Association Search Problem: • Find MSC that is the most associated with the disease • Measure: positive predictive value = find (non-)diseased-free cluster of maximum size • Bad news: Generalization of max independent set • NP complete and cannot be well approximated • Hope: sample S is not arbitrary
Complimentary Greedy Algorithm • Algorithm • Start with C=S (resp. MCS is empty) • Repeat until h(C)=0 (non-diseased-free) • Find 1-SC s maximizing (h(C)-h(C {s})) / (d(C) – d(C {s})) = minimize payment with diseased for removal of non-diseased • Add s to SNPs of C’s MSC • Analogy: finding independent set by greedy removing highest degree vertecies • Extremely fast but inaccurate • Can be used in susceptibility prediction
Most disease-associated & disease-resistant MSC Comparison of three methods for searching the disease-associated and disease- resistant multi-SNPs combinations with the largest PPV. The starred values refer to results of the runtime-constrained exhaustive search
Genetic Susceptibility Prediction • Given: Genotypes of diseased and non-diseased individuals, Genotype of a testing person. Find: The disease status of the testing person Genotype Disease Status -1 -1 -1 -1 1 1 1 1 0101201020102210 0220110210120021 0200120012221110 0020011002212101 1101202020100110 0120120010100011 0210220002021112 0021011000212120 healthy sick testing - gt 0110211101211201 s(gt)
Cross-validation • Leave-one-out test: The disease status of each genotype in the data set is predicted while the rest of the data is regarded as the training set. Predicted Disease Status Real Disease Status Genotype -1 -1 0101201020102210 -1 -1 0220110210120021 Accuracy = 80% -1 1 0200120012221110 1 1 0020011002212101 1 1 0020011002212101 • Leave-many-out test: Repeat randomly picking 2/3 of the population as training set and predict the other 1/3.
Quality Measures of Prediction (confusion table) • Sensitivity: The ability to correctly detect disease. sensitivity = TP/(TP+FN) • Specificity: The ability to avoid calling normal as disease. specificity = TN/(FP+TN) • Accuracy = (TP +TN)/(TP+FP+FN+TN) • Risk Rate: Measurements for risk factors.
Prediction Methods • Support vector machine • Random forest • LP-based prediction
Prediction via Clustering • Drawback of the prediction problem formulation = need of cross-validation no optimization • Clustering P = partition into clusters defined by MSC’s • Minimizing number of errors • S.t. bounded information entropy –∑(Si/S) log(Si/S) • Model-fitting prediction • Set status of testing genotype to diseased • Find number of errors • Set status of testing genotype to diseased • Find number of errors • Predict status that implies lesser number of errors
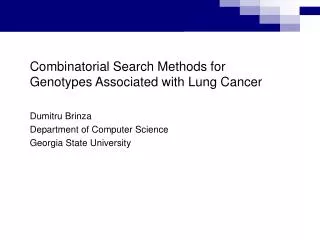
Leave-1-out cross-validation results Leave-one-out cross-validation for combinatorial search-based prediction (CSP) and complimentary greedy search-based prediction (CGSP) are given when 20, 30, or all SNPs are chosen as informative SNPs.
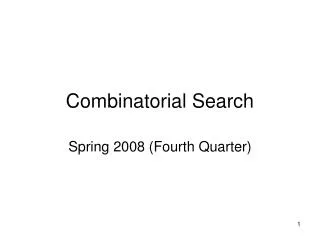
ROC curve Comparison of 5 prediction methods on (Barkash et. al,2006 ) data on all SNPs. Area under the CSP’s curve is 0.81 vs 0.52 under the SVM’s curve.
Conclusions • Combinatorial search is able to find statistically significant multi-gene interactions, for data where no significant association was detected before • Complimentary greedy search can be used in susceptibility prediction • Optimization approach to prediction • New susceptibility prediction is by 8% higher than the best previously known • MLR-tagging efficiently reduces the datasets allowing to find associated multi-SNP combinations and predict susceptibility
International Symposium on Bioinformatics Research and Applications May 6-9, 2007, Georgia State University, Atlanta, Georgia http://www.cs.gsu.edu/ISBRA/ ISBRA provides a forum for the exchange of ideas and results among researchers, developers, and practitioners working on all aspects of bioinformatics and computational biology and their applications Submissions must and must not exceed 12 pages in Springer LNCS style The proceedings of ISBRA 2007 will be published in LNBI Important Dates Symposium Organizers •General Chairs: Dan Gusfield (University of California, Davis) and Yi Pan (Georgia State University) • Program Chairs: Ion Mandoiu (University of Connecticut) and Alexander Zelikovsky (Georgia State University)
History of ISBRA • ISBRA is the successor of the International Workshop on Bioinformatics Research and Applications (IWBRA), held on • May 22-25, 2005 in Atlanta, GA and • May 28-31, 2006 in Reading, UK • in conjunction with the International Conference on Computational Science • The two editions of IWBRA have enjoyed a great success, with special issues devoted to full versions of selected papers in • Springer LNCS Transactions on Computational Systems Biology and • IEEE/ACM Transactions on Computational Biology and Bioinformatics
Support Vector Machine (SVM) Algorithm • Learning Task • Given: Genotypes of patients and healthy persons. • Compute: A model distinguishing if a person has the disease. • Classification Task • Given: Genotype of a new patient + a learned model • Determine: If a patient has the disease or not. Linear SVM Non-Linear SVM
Random Forest Algorithm • Random Forests grows many classification trees. To classify a new object from an input vector, put the input vector down to each tree in the forest. Each tree gives a classification, and we say the tree “votes” for that class. The forest chooses the classification having the most votes (over all the trees in the forest). • Growing Tree, Split selection and Prediction. • Random sub-sample of training data, Random splitter selection.
LP-based Prediction Algorithm • Model: • Certain haplotypes are susceptible to the disease while others are resistant to the disease. • The genotype susceptibility is assumed to be a sum of susceptibilities of its two haplotypes. • Assign a positive weight to susceptible haplotypes and a negative weight to resistant haplotypes such that for any control genotype the sum of weights of its haplotypes is negative and for any case genotype it is positive. • For each vertex-haplotype hi assign the weight pi, such that for any genotype-edge ei,j =(hi,,hj ) where s(ei,j ) {-1,1} is the disease status of genotype ei,j. The sum of absolute values of genotype weights is maximized.