Understanding Volcanic Prediction Methods and Warning Signs
Discover how seismic activity, ground movement monitoring, and remote sensing aid in predicting volcanic eruptions. Learn how magma behavior, gas release, and ground deformation provide essential clues to volcano monitoring.

Understanding Volcanic Prediction Methods and Warning Signs
E N D
Presentation Transcript
Why are there warning signs? • Before an eruption, magma moves into the area beneath the volcano and collects in a magma chamber, or reservoir. As it comes closer to the surface, the magma releases gases. These events can offer valuable clues about the likelihood of an eruption. For example, the movement of magma produces small earthquakes and vibrations (seismicity). Magma gathering in a chamber causes slight swelling of the volcano's slopes. Gases released near the volcano can be measured for changes in quantity and makeup. • Info from: http://www.learner.org/interactives/volcanoes/forecast.html
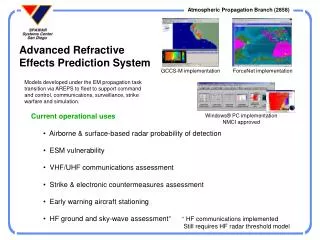
USGS reason for monitoring • Monitoring volcanoes helps them answer critical questions that need to be answered so they can assess the threat and also communicate this to people. • Example: Mt St Helen’s Activity 2005 • Increase in seismic activity, then assessed other things such as gases as you can tell if the magma is moving towards the surface. • When they looked at the history and the data they had collected they could tell what was moving towards the surface. • The possible compositions helped them work out what types of hazards could occur, so that then helps them figure out what threat they are going to be. • Info from: http://volcanoes.usgs.gov/activity/methods/
Studying past eruptions • Scientists look at past eruptions, and by looking at the products and debris that was left behind, they can tell a lot about the volcano and how it erupts, that can tell us what the hazards are like and what to look out for. • By knowing the volcano better we can also start to spot the warning signs better so they have more time to make more accurate predictions. • Info from: http://www.learner.org/interactives/volcanoes/forecast.html
Remote sensing • Satellite imagery can be used to predict volcanic eruptions. • Landsat images which show the amount of energy from the sun being reflected from the earth's surface when an image is taken by a satellite, can be used to indicate environmental change and can be used to identify areas affected by an eruption. • Infra-red images of volcanoes can be made every 15 minutes by geo-stationary satellites allowing thermal mapping to be used to detect hot spots where magma is rising to the surface, enabling a warning to be given. • In 1998, the eruption of Pacya in Guatemala was detected a week before it happened by a satellite using infra-red detectors. A heat signal was picked up indicating hot magma rising to the surface. • However, in some areas the sheer number of volcanoes combined with the poverty of the area means the technique is less useful. • Where it can be used, it can however provide valuable hours or even days in which to evacuate people from areas facing an impending eruption • Info from: http://geobytesgcse.blogspot.co.uk/2007/01/volcanoes-prediction-technology-and.html
Seismicity – record of ground movement • Seismometer is used to measure these. They produce a graph of time vs. amplitude. • Earthquakes almost always increase before a volcanic eruption. This is due to the magma and gas rising u pushing its way up through the fractures in the rock. • Most volcano related earthquakes are a magnitude of 2-3, and only occur around 10km below the ground. • The earthquakes tend to come in clusters, and when this begins to happen, the volcanologist study the waves and hope to work out any odd waves out and use that to help them predict when the volcano will erupt. • There are normally 4-8 seismometers within a 20km radius of the volcanoes vent. These are put here so they can detect the tiny earthquakes M1-2 (as these are sometimes the only indication). • Amplitude of the waves is related to: 1) the magnitude of the earthquake, 2) the direction the wave travelled when it hit the seismometer (from below or at an angle?), 3) the medium the wave travelled in: soft sediment can amplify waves that were small when travelling through solid rock. • Info from: http://www.iris.edu/hq/files/programs/education_and_outreach/aotm/16/VolcanoMonitoring_Background.pdf
Different waves • ‘A’ wave - rock breaking • ‘B’ wave (long period events) – pressure building liquid rock/gas pushing through the rock (vibrations) Bernard Chouet – discovered these due to looking at Nevado Del Ruiz’s seismograms Info & image from: http://volcanogeek.wordpress.com/2011/08/29/the-long-period-event/
Ground Deformation Tilt meters GPS • One of the oldest methods for measuring rising magma. • When magma forces the ground up the surrounding ground tilts away from the centre by a fraction of a degree. • When the ground subsides the ground tilts towards the centre. • Electronic tilt meters used on volcanoes to monitor this, most widely used piece of equipment on volcanoes. • They are very similar to a carpenters level, liquid with a bubble ( to measure angle) and electrodes in the bubble to measure the bubbles position. • The angles can be measured to micro radians. • Info from: http://www.iris.edu/hq/files/programs/education_and_outreach/aotm/16/VolcanoMonitoring_Background.pdf • We have lots of satellites above us • Volcanologists put GPS receivers over a few of the volcanoes benchmarks. • Then they monitor the receivers over a length of time between 8-24 hours. • They then calculate the change in positions using more precise satellite locations and atmospheric delay. • Info from: http://www.iris.edu/hq/files/programs/education_and_outreach/aotm/16/VolcanoMonitoring_Background.pdf
Volcanic gases • Gases dissolved in magma are the driving force of volcanic eruptions • Sulphurous gases and steam are the most noticeable. • Objective of monitoring gases – to detect the change in different gases, often carbon dioxide and sulphur dioxide. • Gases difficult to measure regularly. • To sample gases scientist have to go to a hot fumaroles or a active vent. • Some volcanoes gases that are being released go straight into cater lakes • This makes sampling very hard to do, impossible to do and/or very dangerous. • Sulphur dioxide is acidic so easily dissolves in water, this makes it very hard to monitor, as it is harder to recognise, so carbon dioxide has become a large part of gas monitoring. • Info from: http://www.iris.edu/hq/files/programs/education_and_outreach/aotm/16/VolcanoMonitoring_Background.pdf
High frequency wave = rock breaking • Low frequency wave = crack vibrating • Volcanic tremor = crack vibrating