Download
1 / 83
870 likes | 1.58k Vues
The History and Future of Weather Radar and Storm Prediction. ASPRS Technical Session Dr. Jerry Brotzge Director of NetRad Operations Center for Analysis and Prediction of Storms September 28, 2006. Why present weather radar to ASPRS?. Weather radar is critical to seeing the 3D structure

E N D
The History and Future of Weather Radar and Storm Prediction ASPRS Technical Session Dr. Jerry Brotzge Director of NetRad Operations Center for Analysis and Prediction of Storms September 28, 2006
Why present weather radar to ASPRS? • Weather radar is critical to seeing the 3D structure • of storms, and for severe storm situations, • that’s key for analysis and prediction. • Many new weather-based radar technologies include • GIS and merging of non-radar data sets • (e.g., satellite data) • You know more about satellites, GIS, and mapping • than I do.
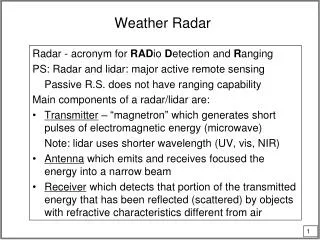
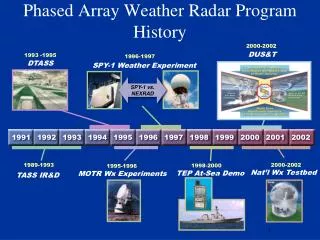
Sir Robert Watson-Watt recognized the • use of “sferics” in 1922 to locate t-storms. • Radio research in 1930s recognized • weather, ships & planes interfered with radio. • By 1935 Sir Watson-Watt was investigating • the use of EM waves to detect aircraft. • In 1940, S. Taylor and F. Furth of the U.S. navy • coined “RADAR” – ‘RAdio Detecting And Ranging’ * SCR-658 radio direction finder used to track radiosonde balloons a.k.a., "bedsprings" antenna. ~ 1945 http://www.photolib.noaa.gov/historic/nws/wea01200.htm
The First Radar Network • British Chain Home (CH) network • Operated in HF portion of spectrum • Development of klystron electronic tube • Improved radars operated in higher freq • Developed smaller, airborne radar • 360-ft tower at Great Baddow in Essex http://en.wikipedia.org/wiki/Chain_Home
The First Weather Radar Networks • Panama: April-May, 1944 • 4 radars • Transmitted data on Teletype • Produced regular radar reports • (RAREPs) • India: Summer, fall 1944 • APQ-13 radars (X-band) • - Bombing & navigation system • - Used from 1944 - 1977 http://www.american-european.net/images_common/panama-map.jpg/ http://history.amedd.army.mil/booksdocs/wwii/orgadmin/map13.jpg
SCR-584 mobile radar unit. http://www.century-of-flight.freeola.com/Aviation%20history/evolution%20of%20technology/Radar.htm
Mobile radar set AN/TPL-1: Designed for ‘searchlight control’. Had a range of 60,000 yards, provided warning of approaching storms, and used to track upper wind observation instrument packages. - "AAF Manual 105-101-2 Radar Storm Detection," by Headquarters, Army Air Forces, August 1945. (Picture taken 1944) http://www.photolib.noaa.gov/historic/nws/
The oldest preserved • photos of a radar • display of a • meteorological • phenomenon. • Photo is of a cold front • approaching Boston, • MA July 22, 1943.
First operational weather radar images… – 1945 • After WWII, military radar began to be used for civilian purposes – • weather detection and air traffic control. http://www.history.noaa.gov/stories_tales/radar_detect.html http://www.history.noaa.gov/stories_tales/radar.html
First tornado observed with radar… – 1953 • Observed 9 April, 1953 north of Champaign- • Urbana. Photo taken by D. Staggs. http://chill.colostate.edu/tornado_1953/index.html.asof.16jan04
First recorded tornado observed with radar… – 1953 • May 11, 1953 – Waco, TX – 119 d. • June 8, 1953 - Flint, MI – 115 d. • June 9, 1953 - Worcester, MA – 94 d. • Research radar – APS-15A. • X-band, 3 deg beamwidth http://chill.colostate.edu/tornado_1953/index.html.asof.16jan04
Texas Tornado Warning Network • Federal, State, local gov’ts, and • university partnership. • Total 17 radars installed. http://www.met.tamu.edu/TAMSCAMS/history/1956radars.jpg
Sept 16, 1946 hurricane, • 135 mi SE of Orlando, FL. • Only the 3rd hurricane to be • documented from radar. http://www.photolib.noaa.gov/historic/nws/hurr2.html http://www.photolib.noaa.gov/historic/nws/wea01228.htm
The Weather Bureau’s New Flagship Radar…the Weather Surveillance Radar – 1957 (WSR-57) Kantor, A. and D. Grantham, 1969: Effect of range on apparent height and frequency of high-altitude radar precipitation echoes. Mon. Wea. Rev., 429-431.
Weather Surveillance Radar – 1957WSR-57 http://www.nssl.noaa.gov/stories/radar2.html http://www.srh.noaa.gov/ohx/research/history.htm
Weather Surveillance Radar – 1957WSR-57 http://www.nssl.noaa.gov/stories/radar.html http://www.srh.noaa.gov/mfl/history/wsr57.jpg http://homepages.wmich.edu/~b1naftel/Radar_SWLMich.gif
Tornado observed • near Meriden, KS, • May 19, 1960. http://www.photolib.noaa.gov/historic/nws/wea01223.htm
Data Transmission Teletype machines, installed 1961 http://www.navis.gr/meteo/images/fax_mach.jpg http://www.crh.noaa.gov/iwx/program_areas/wxpics/history/index.php
Modern Era of Radar…Doppler, NEXRAD, and High-performance Computing
Doppler Radar – the next step forward… • The Weather Bureau’s first Doppler radar. It was an experimental • continuous-wave X-band radar obtained from the Navy. • Recorded 205 mph winds from a tornado. (Calculations not done in real-time!) http://www.photolib.noaa.gov/historic/nws/wea01227.htm
Doppler Radar • Doppler radar provides the ability to measure radial velocity. http://ww2010.atmos.uiuc.edu/(Gl)/guides/rs/rad/ptrn/ptrn2.rxml http://www.crh.noaa.gov/gid/Web_Stories/2004/weather/05-16/05_16_04_Severe.php
Dual Doppler Radar • Doppler radar can only measure the radial wind; therefore, • ideally, you prefer 2 radars at 90 deg angles. http://apollo.lsc.vsc.edu/classes/remote/lecture_notes/radar/doppler/graphics/dual_doppler_geometry.free.gif
Dual Doppler Radar • The first dual Doppler radar observations of a tornadic storm. • (April 24, 1974) http://www.nssl.noaa.gov/40thanniversary/talks/doviak/slide17.html
Weather Surveillance Radar – 1988 DopplerWSR-88D • Development of the • pulse pair processor • (PPP) 1965-1978 • JDOP: Joint Doppler • Operational Project, • 1978-1979 • Approx 158 WSR-88Ds; • installed 1990-1997. • Jointly operated by the • NWS, DoD, and FAA.
Terminal Doppler Weather Radar (TDWR) • Needed for detection of wind shear near airports • Continuous coverage near the airport • Shorter wavelength (C-band) – freq space available • Narrow beamwidth for improved spatial resolution Courtesy: Dr. Kelvin Droegemeier
NWS Operational Performance Source: NWS Office of Science and Technology Courtesy: Dr. Kelvin Droegemeier
NWS Operational Performance Source: NWS Office of Science and Technology Courtesy: Dr. Kelvin Droegemeier
NWS Operational Performance Source: NWS Office of Science and Technology Courtesy: Dr. Kelvin Droegemeier
Near-Term NEXRAD Improvements (2005-2010) • NEXRAD Open Radar Product Generator - ORPG • New Software/Algorithms • Integrate FAA Weather Radar (TDWR, ASR-9/11) • NEXRAD Open Radar Data Acquisition – ORDA • New Processor/Data Quality/Data Resolution/RV Ambiguity Mitigation • Dual Polarization Upgrade • Data Quality/Precip Estimation/Hail Detection/Tornado Detection/Microphysical Assimilation Courtesy: Don Burgess, NSSL
Scheduled upgrades: Open Radar Data Acquisition (ORDA) Courtesy: Don Burgess, NSSL
ORDA BWER Detection140 km/75 n mi Range Legacy RDA (Height 4.9 km/16 kft) ORDA Courtesy: Don Burgess, NSSL
ORDA Hook Echo Detection40 km/22 n mi Range Height 120m/400 ft at 0.0o elevation angle May 9, 2003 – 2nd OKC Tornado (F3) Courtesy: Don Burgess, NSSL
Conventional Radar Dual Polarization Polarimetric Radar Courtesy: Dr. Terry Schuur, NSSL
Dual Polarization http://ibis.nmt.edu/nmt_lms/rhi_radar.html
Dual Polarization Tornado Signature Description: Radar Return from Tornado Debris • Utility • Prevent missed tornadoes • Pinpoint tornado location, accurate Severe Weather Updates • Limitations • No Lead Time • Not seen with most weak (F0/F1) tornadoes • Not seen at ranges longer than 50 nm • Future Work • Define maximum detection range • Define wind strength need for debris lofting • Collect more data, including bow echoes * Tornado precursor signature may exist within developing hook echo precip distribution Courtesy: Don Burgess, NSSL
Feature Detection Algorithms Mesocyclone Detection Algorithm Velocity Thresholding And De-Aliasing Build Shear Segments CAPS is Developing New Variational Algorithms Far Superior to Current Operations For a Single Elevation Angle, Compare Radial Velocity in Adjacent Gates at the Same Radial Distance to Identify Azimuthal Shear; Continue Along Each Azimuth Until Shear Vanishes Start Compute Attributes Data base of shear segments based upon range-dependent gate-to-gate velocity thresholds 2-D Vortex Cores with strength rank Strength Ranks And Shear ID Compute attributes (e.g., vorticity) 2-D Shear Features at a Single Elevation Angle Source: Stumpf et al. (1999) Courtesy: Dr. Kelvin Droegemeier
o 2.4 o Storm cloud 1.5 o 0.5 WSR-88D Mesocyclone Cloud base Feature Detection Algorithms Mesocyclone Detection Algorithm Data Base of Screened 3D “Features” 2-D Vortex Cores with strength rank Compute and Store Attributes Vertically Associate 2-D Vortices Center location, Diameter, Rotational Velocity, Depth, Base, Top, etc Compare expectedlocation with actual;search at increasingradii; trackage of features Time Association 3-D Vortex Features (accounts for beam-spreading) Refined Data Base of 3D Vortices Vortex diagnostics Graphics Processing Table of Mesocyclones Classify based uponstrength, age, spatialorientation ranking Forecaster Workstation End Source: Stumpf et al. (1999) Courtesy: Dr. Kelvin Droegemeier
Reflectivity Velocity Rotational shear Rotation tracks Courtesy: Kurt Hondl, NSSL
SCIT: Storm Cell Identification And Tracking Algorithm Courtesy: Kurt Hondl, NSSL
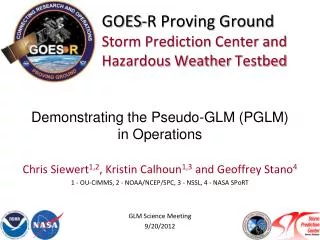
New Paradigm for Future NWS Tornado Warnings • Present – use NEXRAD (and other radars) to identify precursor signatures of tornadic storms, then extrapolate into the future. (Warn on DETECTION) • Future – use high resolution radar data to initialize cloud resolving forecast models to identify precursors 30-45 minutes in advance. (Warn on FORECAST) Courtesy: Don Burgess, NSSL
Assimilation/Model Timeline OBSERVATIONS MODEL Temp. Perturbations Added 20 min First Echoes First Echoes 55 min Data Assimilation Mature Supercell 20 min Tornadogenesis Forecast 35 min Tornado Dissipation Courtesy: Don Burgess, NSSL
Future Tornado Warning Issues at time t=0 min. Courtesy: Don Burgess, NSSL
Data Assimilation System Forecast Models Radars Detection Algorithms Applied to Gridded Fields Other Observations 3D Gridded Analysis That Contains all Variables, is Dynamically Consistent, and has Minimum Global Error w/r/t the Observations Features and Relationships Forecast Model Output Courtesy: Dr. Kelvin Droegemeier
Observation 00 03 12 06 15 (hour) 09 Analysis Analysis Analysis forecast forecast Routine forecast Assimilation cycles General Concept of Data Assimilation Objective: produce an analysis on a regular grid by combining all the available information on regular or irregular grids Available information: Observation, background, model, uncertainties http://meted.ucar.edu/AMS_Radar05.htm; Presentation by J. Sun
z2 Height z0 z1 Data grid Model grid radar X-distance Illustration of vertical grid mapping http://meted.ucar.edu/AMS_Radar05.htm; Presentation by J. Sun