Surface Plasmon Resonance for Immunoassays
380 likes | 1.05k Vues
Surface Plasmon Resonance for Immunoassays. Sadagopan Krishnan Chem 395 Instructor: Prof.Rusling. Outline. Introduction Understanding the Basics SPR- Instrumental components Applications in Immunoassays Advantages / Disadvantages Summary. What is SPR?.

Surface Plasmon Resonance for Immunoassays
E N D
Presentation Transcript
Surface Plasmon Resonance for Immunoassays Sadagopan Krishnan Chem 395 Instructor: Prof.Rusling
Outline • Introduction • Understanding the Basics • SPR- Instrumental components • Applications in Immunoassays • Advantages / Disadvantages • Summary
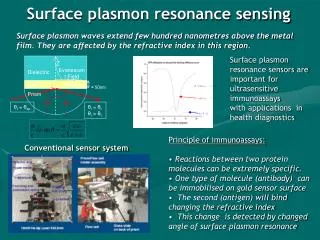
What is SPR? • Surface sensitive optical detection method–interactions between biomolecules protein-protein protein-ligand protein-DNA protein-membrane • Phenomenon that occurs when light is reflected off thin metal films. • Light energy interacts with the delocalized e-s in the metal surface – reduced reflected light intensity. • Identification and Quantification (association, dissociation and equilibrium constants, and energetics) of these interactions.
Understanding the Basics of SPR Refractive Index (RI) = Ratio of speed of light in vacuum to that in a denser medium www.microscopyu.com
Molecule A -------------------------------------------------- -------------------------------------------------- -------------------------------------------------- -------------------------------------------------- medium Metallic film (d < λ ) Glass θ Prism Electromagnetic wave Principle of SPR operation (adsorbed layer) • Tunneling of Electromagnetic field into interior side of surface (forming evanescent wave) and reflection. • Photon energy absorbed by electrons on the surface when their momentum are equal (resonance condition). • Oscillating electrons on the surface at resonance called “plasmons” hence the name “surface plasmon resonance” and the angle θSPR .
Evanescent wave and θSPR ~200-300 nm • At θSPR , the reflected light intensity decreases and this difference is measured in SPR. • When a molecule B interacts with immobilized A, shift in θSPR (or λSPR) can be observed due to change in refractive index. www.sys.eng.shizuoka.ac.jp/~j-kondoh/SP1.GIF
Refractive index change and permittivity • Refractive index change is related to the permittivity of the medium and adsorbed layer as below. wave vector of radiation Two ways: either keep λ constant and vary θ orvice-versa and observe the change in the light intensity.
Summary-1 We have understood some basic concepts in SPR and interaction of molecules related to the SPR response. -Let us know about immunoassays (remember Jim’s lecture on Immunosensors).
Immunoassays • A biochemical test-measures levels of a particular molecule in biological samples- e.g. serum, urine – uses antibody reaction to its antigen (specific binding). • Clinically important in identifying pathogens. e.g. Prostate specific antigen, highly specific biomarker for prostate cancer. • Monoclonal Antibody – binds only to one site of a particular antigen, hence specific and accurate. • Polyclonal antibody – heterogeneous mixture of antibodies against different epitopes of the antigen.
Immobilized Ab Antigen in solution SPR for Immunoassays L - light source, P - prism, S – sensor surface, D– photodiode array, F- flow cell, Light intensity drop at times t1 and t2. t1 = before binding the antigen; t2 = resonance position after binding the antigen. www.astbury.leeds.ac.uk/facil/SPR Biacore SPR
SPR Sensogram www.astbury.leeds.ac.uk/facil/SPR Biacore SPR
Kinetics- Analysis of Experimental SPR Curves ka A + B A-B complex , kd Fit the experimental curve into various reaction models* and get the kinetic parameters from the best fit. (1)Pseudo first-order reaction model (2)Mass transport limitation model (3)Inhomogeneous ligand model (4)Inhomogeneous analyte model *J. Luo et al. J. Biochem. 130, 553-559 (2001).
antibody Prostate specific Antigen (PSA) binding to monoclonal antibody (mAb) http://www.biology.arizona.edu/IMMUNOLOGY/tutorials/antibody/structure.html
Outline of the paper • PSA- 30 kDa protein - routinely used marker in the diagnosis of prostate cancer. • In this study, 22 participants measured the binding of PSA to a mAb by SPR. • mAb-immobilized on carboxymethyl dextran surface- amine-coupling chemistry using EDC and NHS. • Three different densities of mAb immobilized-varying contact times and dilution. • [PSA] used in 2.5-600 nM range for ka calculation. • [PSA] of 600 nM for kd experiment. • Global fitting of data using 1:1 interaction model. Katsamba et al. Analytical Biochemistry 352 (2006) 208–221.
PSA/mAb – association and dissociation kinetics • Association phase of the PSA/mAb interaction over a PSA concentration range is reproducible. • Dissociation phase of PSA/mAb interaction at [PSA]=600nM is reproducible. Spikes are artifacts arising from the filling of syringes. Katsamba et al. Analytical Biochemistry 352 (2006) 208–221.
Analysis: 1:1 interaction model (A+B=AB), Scrubber software Black lines = experimental (increasing concentrations of PSA) Orange lines = model fit Katsamba et al. Analytical Biochemistry 352 (2006) 208–221.
Distribution of kinetic rates & equilibrium binding constants among 22 users ka = (4.1±0.6) x 104 M-1 s-1 kd = (4.5±0.6) x 10-5 s-1 Equilibrium Binding constant, Katsamba et al. Analytical Biochemistry 352 (2006) 208–221.
Advantages • Real time analysis & Label free technique – No need for radioactive, fluorescent or any other labelling. • The Change in SPR signal - specific to the binding event - no need for purified sample – antigen in extracts can be used. • Highly sensitive (RI changes <10-5 with time resolution of few seconds) and simple construction.
Disadvantages • Mass transport can affect kinetic analysis. • Any artifactual RI change other than from the interaction can also give signal. • One of the interacting molecules should be immobilized on the surface. • Thickness of the metal film (thin film is preferred).
Summary-2 • Surface plasmon resonance has been shown to be a powerful technique in studying real-time kinetics of immunoassays. • Its advantages over other techniques can be understood.
Acknowledgements • Prof. Rusling • Prof.Kumar • Chem 395 class
Thank You Questions?
Thickness and Surface concentration from SPR d =thickness of the adsorbed layer Id = decay length of evanescent wave R = change in bulk index of refraction m= slope of R vs ∆η plot ηa = refractive index of adsorbed layer ηs = refractive index of bulk solution. *J. Luo et al. J. Biochem. 130, 553-559 (2001).
Adsorption kinetics- anti-transferrin binding to staphylococcal protein A *J. Luo et al. J. Biochem. 130, 553-559 (2001).
Differential rate equations of various reaction models* *J. Luo et al. J. Biochem. 130, 553-559 (2001).