Download
1 / 8
110 likes | 322 Vues
Needs Assessment Sample Clover School Data. Source: ADE, Federal Programs and School Improvement Units 2013-14 . Step 3: Create a School Profile – Needs Assessment. Demographic Data. 10% Grade Retention Rate 89% Attendance Rate

E N D
Needs Assessment Sample Clover School Data Source: ADE, Federal Programs and School Improvement Units 2013-14
Demographic Data • 10% Grade Retention Rate • 89% Attendance Rate • 20% (n = 90.4) of students were referred to office in 2013-2014 SY • 15% (n = 67.8) of students received Out-of-School Suspension in 2013-2014 SY Focus status: • 50% of student passed in English Language Arts (ELA) Benchmark • 45% passed in Math Benchmark • 42% passed in Science Benchmark • There were 32 teachers on staff, giving Elementary School a student-teacher ratio of 14.1 • 2 teachers are not HQ • 35% of parents attend p/t conferences. • 452 students attended Clover Elementary School in the 2013-2014 school year. • 5th Grade – 69 Students • 4th Grade - 68 Students • 3rd Grade - 70 Students • 2nd Grade - 75 Students • 1st Grade- 85 Students • Kindergarten - 66 Students • Pre-Kindergarten - 19 Students • 85% African American • 10% Hispanic • 5% Caucasian • 99% Economically Disadvantaged
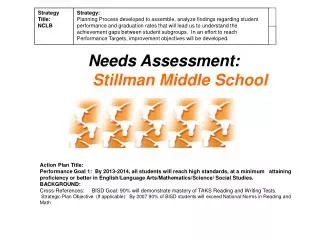
Step 3: Create a School Profile – Needs Assessment 94% 30/32 of teachers are HQ (HQ State Report) Increase HQ teachers to 100% by May 2015
10 minute Guided Practice- Each table will be given a set of data and a large chart of Step 3. Teams will first work on the sample data (Slide 3) as a group to determine where the school is based on the specific data provided. Determine which given Focus area(s) align with the data. Then the team will identify the findings and write the areas of need in the first column- “Where is the school…..” Be prepared to share out the findings with the entire group if your table is called. If the table completes the list of findings before time expires, the table is encouraged to write the expected outcome in the third column- “Where do we want to be?”. Needs Assessment sample Instructions *The focus areas are based on needs.
Demographic Data • 10% Grade Retention Rate • 89% Attendance Rate • 20% (n = 90.4) of students were referred to office in 2013-2014 SY • 15% (n = 67.8) of students received Out-of-School Suspension in 2013-2014 SY Focus status: • 50% of student passed in English Language Arts (ELA) Benchmark • 45% passed in Math Benchmark • 42% passed in Science Benchmark • There were 32 teachers on staff, giving Elementary School a student-teacher ratio of 14.1 • 2 teachers are not HQ • 35% of parents attend p/t conferences. • 452 students attended Clover Elementary School in the 2013-2014 school year. • 5th Grade – 69 Students • 4th Grade - 68 Students • 3rd Grade - 70 Students • 2nd Grade - 75 Students • 1st Grade- 85 Students • Kindergarten - 66 Students • Pre-Kindergarten - 19 Students • 85% African American • 10% Hispanic • 5% Caucasian • 99% Economically Disadvantaged