Integrating Data Analysis at Berea College
240 likes | 269 Vues
Berea College, a small liberal arts college with a 3-person department, is a part of the NSF Integrating Data Analysis project. This project aims to integrate data analysis across the curriculum to enhance research skills and build quantitative skills. Despite the challenges of heavy teaching loads and lack of teaching assistants, the college saw the value of adding data analysis due to small class sizes and students having their own laptops. By using modules from DataCounts, students learn research and data analysis skills through ready-made online modules, which include all components of a research project. An example of integrating data analysis is the Influence of Race and Gender on Income module used in a social problems class. Students acquire quantitative skills such as creating and interpreting bivariate tables, making data-based comparisons, and reading and writing stories about income inequality using data as evidence.

Integrating Data Analysis at Berea College
E N D
Presentation Transcript
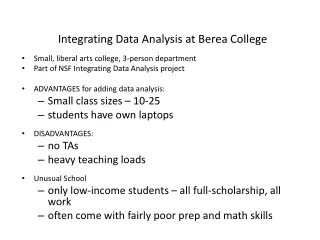
Integrating Data Analysis at Berea College • Small, liberal arts college, 3-person department • Part of NSF Integrating Data Analysis project • ADVANTAGES for adding data analysis: • Small class sizes – 10-25 • students have own laptops • DISADVANTAGES: • no TAs • heavy teaching loads • Unusual School • only low-income students – all full-scholarship, all work • often come with fairly poor prep and math skills
Quantitative Skills being taught before and after IDA • Until 2002, very little data analysis in courses: • 1st year: GSS exercise in Intro • Senior year: GSS in Methods • Senior year: Collect own data in Capstone • Very little in between • Soc Majors – often math-phobes, failed pre-meds • Saw adding QL as way to enhance research skills and build and maintain skills across the curriculum
Integrating Data Analysis Across our Curriculum At beginning, our department: • Outlined Quantitative Skills for all majors • Mapped skills onto Courses
Teaching Research and Data Analysis Skills by using Modules from DataCounts1 • Ready-made modules online • Students use these online data sets (so not finding own data) But, if set up properly, can include all components of research project: • pose question • review lit • propose hypotheses • analyze data – test IVs on DV • interpret tables and relationships between variables • make conclusion 1DataCounts!: http://ssdan.net/datacounts/index.html
Example: Influence of Race and Gender on Income1 Used in Social Problems class, 100-level course • 20 students in class • Takes four 50-minute class days • Could be modified to be shorter or longer Substantive GOALS: • Learn about race and gender inequality in income • Make national and state comparisons in terms of earnings using American Community Survey (08) 1module available online at: http://serc.carleton.edu/sp/ssdan/examples/31584.html
Quantitative Skills Acquired: Students will: • Create and read frequency tables • Learn logic of independent and dependent variables • Create and interpret bivariate tables • Learn to make data-based comparisons across states • Read and write a “story” about income inequality using data as evidence
Day 1: How to Read Frequencies in a Handout Reading Frequencies: Example 1: ACS sample of full-time, year-round workers in 2008. Points to make to students about a frequency table: • Have both percentages and numbers • To make comparisons, we will usually focus on the percentages • Percentages should add up to 100% • Must understand base (all full-time year-round workers in 2008)
Day 1: Start by Learning How to Read Frequencies in a Handout Test for common mistakes: Sex Composition of Full-Time, Year-Round Workers, 2008 Which of the following is true? A. 58.7% of the workforce is male. B. 58.7% of men are in the workforce. Answer: A is correct.
Day 1: Reading Frequencies Example 2: examine earnings of full-time workers Start by asking students to guess: What percent of full-time workers earn over $100,000? What percent earn less than $15,000? Table 2: Earnings for Full-Time Year-Round Workers, US, 2008
After frequencies, examine bivariate tables • Now ask students to guess: Who makes more, men or women? • How might we determine that? • Show a bivariate table of sex and income, and ask them to interpret:
Day 1: Reading a Bivariate Table Earnings by Sex, ACS 2008 • Must determine how to read this table – where to focus? • Teach students to focus on top and bottom portions for comparisons
Day 1: Learn How to Read Bivariate Table Earnings by Sex, ACS 2008 • Give Rules for reading table (included in module materials) • Start with a general statement; use percentages as evidence; end with summary • Teach students useful phrases: • e.g. “A disproportionately high percentage of women fall into the low-income categories. For example, ….”
Day 1: Learn How to Read Bivariate Table Earnings by Sex, ACS 2008 • Test for common mistakes: True or False? • 14% of those who make between $15,000 and $24,000 are men. • False • 14% of men make between $15,000 and $24,000. • True • 25.1% of men earn more than $70,000 • True • 17.2% of men and women earn more than $100,000 • False
Day 1: Learn How to Read Bivariate Table Earnings by Sex, ACS 2008 • Most important take-home message: • Emphasize “telling a story” with numbers
Day 2: Students Run Module in class (or could do as homework) • Module will walk students through an exercise, step by step, for a state of their own choosing to examine • sex earnings • race earnings • Learn independent and dependent variables • Make hypotheses about relationship between variables • Learn how to run frequencies and set up simple bivariate tables • Learn how to create properly labeled tables from the data generated
Day 3: Learn How to Present Data • Students work in pairs on state of own choosing • 5-minute presentation of findings to class: • Give hypothesis (and let others guess) • Show table of results • Describe findings with proper language
Day 4: Peer Review of Paper • Students come to class with completed draft of data analysis paper • In pairs, review and edit one another’s papers, following guided prompts • Main goal: students learn to write “story” using data as evidence
Assessment A) Used 2 forms of assessment a) pre/post-test b) paper, graded by rubric B) Tried to assess both skills and confidence levels
Comparison of Pre-test to Post-test (past four years) Overall score on pre-test : 55 - 60% Overall score on post-test: 80 - 94% Assessment of Pre and Post-test: • Great improvement in basic skills at reading and interpreting exactly this kind of table • Improved confidence in working with data and numbers
Assessment of Paper: • Demands higher-order skills: difficult paper • Skills vary quite a bit • Peer review helpful • Allow re-writes for students with most trouble • Students report that paper is difficult, but worth it
Comments on Student Evals • “I worked a lot in this class, and was always taken to the brink of overwhelmed but not crossing over. I think this is a sign of an excellent class. The data analysis we did was a particular challenge. I came away from the exercise knowing I learned something completely out of my comfort zone.” • “Keep on trying with the Data Analysis.... we (students) need it... no matter how badly we do not like it at first.”
Overview of Module • Have been using for several years, recently updated with 2008 American Community Survey data • Cheerleading helps – keep telling them they’re learning useful skills • Fun to teach– hands-on activity; improves own engagement in teaching these content areas • Students generally enjoy (positive evals) • Pre/post test shows students learn skills • Exams and papers show modules reinforces content [truly see race and gender inequality] • See evidence of skills in later courses