fMRI data analysis at CCBI
fMRI data analysis at CCBI. Vladimir Cherkassky. Detection of Activated Voxels. Always performed on a voxel-to-voxel basis T-test comparing mean values during two experimental conditions (FIASCO) Covariance of the time course with the paradigm function (SPM, Voxcor.id, etc.)

fMRI data analysis at CCBI
E N D
Presentation Transcript
fMRI data analysis at CCBI Vladimir Cherkassky
Detection of Activated Voxels • Always performed on a voxel-to-voxel basis • T-test comparing mean values during two experimental conditions (FIASCO) • Covariance of the time course with the paradigm function (SPM, Voxcor.id, etc.) • Threshold estimation and selection
FIASCO data preprocessing • Baseline correction • de-ghosting • mean correction • motion correction • outlier detection and removal • Trend correction • T-map computation
Processing steps (single subject) • Fiasco processing (active voxel detection) • Co-registration of functional and anatomical data. • Subject-specific ROI definition • Volume and distribution of activation • Functional connectivity • Morphing into standard space
Probability map thresholding • Correction for multiple comparisons • Scanner-specific data properties • Spatial correlation among voxels • Additional considerations • Comparing groups: • “High activators” and “low activators” • Normalization (selecting most activated voxels) • FDR (false discovery rate) method
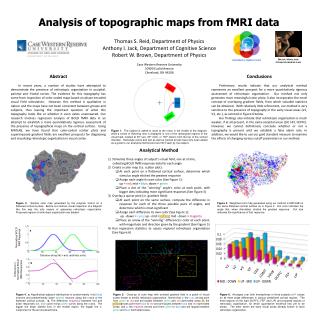
Activation at t=6 and ROIs defined on the basis of subject-specific anatomical landmarks Number of activated voxels per ROI
Processing steps (group analysis) • ANOVA analysis of volume of activation • ANOVA analysis of location of activation (centroids in standard space) • ANOVA analysis of functional connectivity • Standard space averaging (“hit” maps) • Additional analyses: • Factor analysis, MDS, ...
Average volume of activation per ROI for the two groups of subjects: autistic participants and matched control participants. Sentence comprehension task. Highlighted areas show statistically significant group difference. Normalization thresholds used for between-group analysis.
Difference in the distribution of activation in the main language areas for the two groups
Overall pattern of activation:similar pattern for three groups of subjects
Functional connectivity • FC is measured as a correlation between averaged time courses (tc) of activated voxels for the two brain areas (ROIs) • Synchronization can be induced by the connection (direct or indirect) between areas or some common input. • We interpret FC as a measure of interaction between brain areas working together on the same task.
Time course of activated voxels • Useful signal is ~2% • As a result, single voxel tc is extremely noisy • Averaged tc of all activated voxels within an ROI (min number of voxels we use is 3) • Most of the ROIs consist of more than one slice • Correction for the slice acquisition sequence is necessary for proper connectivity estimation • Images to include in time course calculation
Averaged tc for the two areas involved in the language task. Note the scale (% signal change from fixation) and the images included in the analysis.
Averaged tc with different methods of interpolation (correction for slice acquisition time) Though the differences look minor, linear interpolation introduces considerably larger level of correlation between the time courses.
Between subjects variability of the averaged tc (event-related study)
Functional connectivity within the language network for autistic and control groups. Note the systematically higher connectivity level for the control group.
Pairs of areas with statistically significant differences in functional connectivity for the two groups of participants
Overall connectivity pattern: 1. Note the high level of similarity for the two groups (r=0.69 for all measured connections; r=0.95 for the connections with significant differences) 2. Note the systematically higher connectivity for the control group
Conclusions • Our approach provides accurate measures of activation volume and location, as well as functional connectivity between the brain areas. • These measures can be used for testing the effects of experimental manipulations for single subject, group, and between-group analyses.