Analysis of topographic maps from fMRI data
10 likes | 202 Vues
Analysis of topographic maps from fMRI data. Thomas S. Reid, Department of Physics Anthony I. Jack, Department of Cognitive Science Robert W. Brown, Department of Physics Case Western Reserve University 10900 Euclid Avenue Cleveland, OH 44106. DEPARTMENT OF PHYSICS. Brain, Mind and

Analysis of topographic maps from fMRI data
E N D
Presentation Transcript
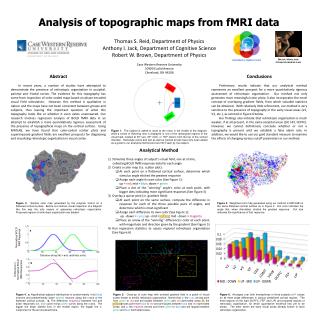
Analysis of topographic maps from fMRI data Thomas S. Reid, Department of Physics Anthony I. Jack, Department of Cognitive Science Robert W. Brown, Department of Physics Case Western Reserve University 10900 Euclid Avenue Cleveland, OH 44106 DEPARTMENT OF PHYSICS Brain, Mind and Consciousness Lab Department of Cognitive Science Abstract In recent years, a number of studies have attempted to demonstrate the presence of retinotopicorganization in occipital, parietal and frontal cortex. The evidence for this topography has come from inspection of color-coded maps based on phase-encoded visual field stimulation. However, this method is qualitative in nature and the maps have not been consistent between groups and subjects, thus leaving the important question of what this topography looks like or whether it even exists unanswered. Our research involves regression analysis of BOLD fMRI data in an attempt to establish a more quantitatively rigorous assessment of the presence of topographical maps on the cortical surface. Using MATLAB, we have found that color-coded scatter plots and superimposed gradient fields are excellent prospects for diagnosing and visualizing retinotopic organization in visual cortex. Conclusions Preliminary results indicate that our analytical method represents an excellent prospect for a more quantitatively rigorous assessment of retinotopicorganization. Our method not only generates more meaningful color plots; it also incorporates the novel concept of overlaying gradient fields, from which valuable statistics can be obtained. With relatively little refinement, our method is very sensitive to the presence of topography in the early visual areas (V1, V2, etc.), as evinced in Figure 6 below. Our findings also indicate that retinotopic organization is much weaker, if at all present, in the extra-occipital areas (LIP, FEF, DLPFC). However, we cannot definitively conclude whether or not a topography is present until we establish a false alarm rate. In addition, we would like to use our gold standard measure to examine the effects of changing various cutoff parameters in our method. Figure 1. The subject is asked to stare at the cross in the middle of the diagram, while a series of flickering dots is displayed in one of the rectangular regions of the visual field, located at 30º (up), 90º (mid), or 150º (down) from the top of the vertical meridian. Rectangle colors and text as well as colored arrows have only been added as a guide to our analytical method and are NOT seen by the subject. • Analytical Method • Stimulate three angles of subject's visual field, one at a time, • collecting BOLD fMRI response data for each angle • Create a color map (i.e. scatter plot): • At each point on a flattened cortical surface, determine which stimulus angle elicited the greatest response • Assign each angle its own color (See Figure 1): • up = red; mid = blue; down = green • Place a dot of the "winning" angle's color at each point, with bigger dots indicating more significant responses (See Figure 3) • Overlay a quiver plot (i.e. gradient field): • At each point on the same surface, compute the difference in response for each of the three possible pairs of angles, and determine which is most significant • Assign each difference its own color (See Figure 1): • up - down = cyan; up - mid = ; mid - down = magenta • Place an arrow of the "winning" difference's color at each point, with magnitude and direction given by the gradient (See Figure 5) • Run regression statistics to assess regional retinotopic organization (See Figure 6) LIP FEF DLPFC Figure 2. Sample color map generated by the program Carrot on a flattened cortical surface. Before our method, visual inspection of a diagram like this was the only means of assessing retinotopic organization. Proposed regions of retinotopic organization are labeled. Figure 3. Weighted color map generated using our method in MATLAB on the same flattened cortical surface as in Figure 2. Dot color indicates the angle that, when stimulated, elicited the greatest response. Dot size indicates the significance of that response. yellow Normalized BOLD fMRI Response a a Distance along flat x-axis (arbitrary units) b Difference in Normalized BOLD fMRI Responses b c Figure 4. a. Hypothetical adjacent distributions of predominantly mid (blue) neurons and predominantly down (green) neurons along the x-axis of the flattened cortical surface. b. The difference (magenta) between mid and down responses (i.e. blue curve minus green curve) along the x-axis. The bigger the slope (dotted line) in the middle region, the bigger the x-component of the arrow placed there. Figure 5. Close-up of color map with overlaid gradient field in a patch of visual cortex known to exhibit retinotopic organization. Notice that: a.the cyan arrows point from green to red and are largest between green and red dominated areas; b.the yellow arrows point from blue to red and are largest between blue and red dominated areas; and c. the magenta arrows point from green to blue and are largest between green and blue dominated areas. Figure 6. Averages over both hemispheres in three subjects of r2 values for all three angle differences in various predefined cortical regions. The three regions on the right (DLPFC, FEF, and LIP) are proposed regions of retinotopic organization, for which quantitative evidence has yet to be shown. The other seven are early visual areas already known to have retinotopic organization. b. yellow


