Topographic Maps
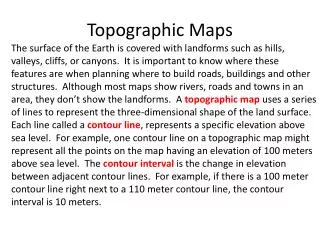
Topographic Maps. Dual Credit Geology Lab # 8. Topographic Maps. Maps in which the three-dimensional configuration of the Earth’s surface (hills and valleys) are represented on a flat, two-dimensional map Relief – the difference in elevation between the high and low points of an area.


Topographic Maps
E N D
Presentation Transcript
Topographic Maps Dual Credit Geology Lab # 8
Topographic Maps • Maps in which the three-dimensional configuration of the Earth’s surface (hills and valleys) are represented on a flat, two-dimensional map • Relief – the difference in elevation between the high and low points of an area
Topographic Map Features • Title and Legend • Scale • Scale Conversion • Latitude and Longitude • Township, Range, and Section • True North and Magnetic North
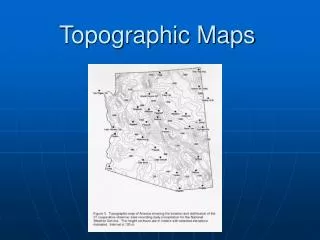
Title and Legend • Title (of map) – usually named after a major geographic feature in the map area • Legend – key to explain symbols used on map • (All USGS maps use the same legend)
Scale • The relationship between true ground distance and distance on the map • Three types used on Topographic maps • Verbal scale • Graphic scale • Fractional scale
Verbal Scale • Gives the scale in words • Example: 1 centimeter = 4 kilometers • Meaning: one centimeter on the map = 4 kilometers on the ground • You will NOT find verbal scales on a Topo map – but must be able to calculate the verbal from the fractional scale
Graphic Scale • Graphic (or bar) scale – shown as a line or bar that has been divided into units representing distances on the ground • Distance – easily measured with a ruler • Always found on Topo maps - usually along the lower margin
Fractional Scale • Ratio between one unit distance on the map and the corresponding distance on the ground • 1:50,000 – means one unit on the map corresponds with 50,000 OF THE SAME unit on the ground • Any units may be used - • BUT the units must be the same
Example of Fractional Scale 1:24,000 Means - one inch on the map represents 24,000 inches on the ground. (Or one centimeter on the map represents 24,000 centimeters on the ground - or any other unit you want to choose).
Scale Conversion • Converting from one scale to another • Convert from fractional to verbal – simply divide by the conversion factors as shown
Conversion • To convert from verbal to fractional do just the opposite and multiply by the conversion factors • Since the fractional scale is a ratio, you multiply by the conversion factors until you have the same units on both sides of the equal sign
Latitude and Longitude • Latitude – lines run parallel to equator, east and west; measured either north or south of 00 (equator) • Longitude – lines run vertically, north and south; measured either east or west of 00 longitude (Prime Meridian)
USGS Topographic Maps • Quadrangles – bounded on north and south by lines of latitude; on east and west by lines of longitude • Common size map is a 15 minute quadrangle (15’ of longitude x 15’ of latitude)- fractional scale 1:62,500
Township, Range, and Section • Township/range system - designate small areas of land very accurately • Use one or more east-west lines called base lines, and one or more north-south lines called principle meridians • From baseline and meridians are additional E/W and N/S lines measured along a 6 mile spacing – creating a grid pattern 6 miles x 6 miles (36 sq miles)
Ranges • Squares along the N/S columns are called ranges • Numbered either East or West of principle meridian • On east of principle meridian: R1E, R2E, R3E, R4E, to west of meridian R1W etc. • As you go farther east and/or west numbers will increase
Townships • Squares along the E/W strips are called townships • Numbered from baseline in similar manner to ranges • (T45N, T56S and so on) • As you go farther east and/or west numbers will increase
Sections • Since squares are 6 miles each they can be further divided into 36 one-mile square sections • Sections numbered 1 to 36 – beginning with #1 in upper northeast corner, ending with # 36 in southeast corner • Every section can be subdivided into quarter sections, designated NE, NW, SE, and SW (These can also be subdivided even further)
True North and Magnetic North • All maps need an arrow so users can determine the orientation of geographic north (900 N latitude) • North usually at top of map (east to right, west to left, and south to the bottom) • Magnetic north is offset from the geographic (true) north • The angle between true and magnetic north is called the magnetic declination and varies depending on location of the map
Assignment • Lab # 8 Topography