Topographic Maps
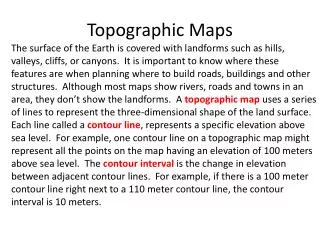
Topographic Maps. elevation. Sea level. Topography is the shape of the land surface features. Topographic maps are also called quadrangles . Elevation is the height above sea level . Depth is the area below sea level . Topographic maps show changes in elevation on Earth’s surface .


Topographic Maps
E N D
Presentation Transcript
elevation Sea level Topography is the shape of the land surface features • Topographic maps are also called quadrangles. • Elevationis the height above sea level. • Depth is the area below sea level. • Topographic maps show changes in elevation on Earth’s surface. depth
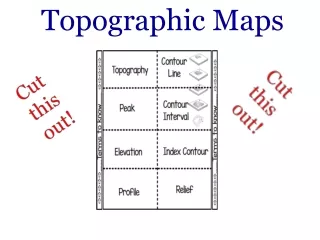
Contour Lines • A contour line is a line drawn on a topographic map that connects points of equal elevations. The shape of the contour reflects the shape of the land. • A contour interval is the vertical difference in elevation between side by side contour lines. • An index contour is usually every fifth line and isprinted as a bold line with the elevation indicatedto help determine elevation of contour lines . • A benchmark is a reference point of elevation, marked as BM. • Relief is the difference between the highest and lowest elevations in a given area.
Contour lines as they cross a stream Rules for Contour Lines. They… 1.Connect points of equal elevation. 2. Never branch, split or cross each other. 3. Are spaced close together to indicate a steep slope, farther apart to show gentle slopes. 4. Represent a hill with a concentric series of closed contour lines. 5. Represent a depression with a concentric series of closed contour lines with hachure marks on the inside. 6. Form a “V” that points upstream when they cross streams. strea stream Direction of water flow Direction of water flow Contour lines as they cross a stream Contour lines as they cross a stream Contour lines as they cross a stream
THE TOPOGRAPHIC MAP Without ever having been to a particular place, and with out talking to someone who has been there, you can already know quite a lot about it with a map. A map is a graphic representation of the earth’s surface drawn to scale, as seen from above. It uses colors, lines, symbols, and labels to represent features found on the ground. However, the finest maps available are worthless unless the map user knows how to read them.
PART 1 Basic Land Navigation Map Margin Information • A map could be compared to any piece of equipment, in that before it is placed into operation the user must read the instructions. • It is important that you know how to read these instructions. • The most logical place to begin is the marginal information and symbols, where useful information telling about the map is located and explained. • All maps are not the same, so it becomes necessary every time a different map is used to examine the marginal information carefully.
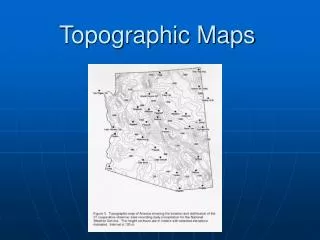
PART 1 Basic Land Navigation Map Margin Information In the upper right corner is the complete quadrangle name. The state is also given, as may be the county. Also included is the area covered and the type of map.
PART 1 Basic Land Navigation Map Margin Information • In the bottom right corner of the map is a • key to roads on the map. • Map name and state. • date of the map - one of the most significant pieces of information available. • quadrangle location shown as a black square superimposed on a state map.
PART 1 Basic Land Navigation Map Margin Information • At bottom center is the • map scale ratio – size of area covered and terrain detail. • Distance bar scales show several alternative units for the measurement of distance. • the contour interval. The contours are the brown lines.
PART 1 Basic Land Navigation Map Scale Medium-scale topo map (1:150,000) SOME DETAIL Large-scale topo map (1:24,000) LOTS OF DETAIL
PART 1 Basic Land Navigation Small-scale map (1:100,000,000) VERY LITTLE DETAIL Medium-scale map (1:250,000) MORE DETAIL Map Scale Large-scale map (1:24,000) LOTS OF DETAIL
TOPOGRAPHIC MAPDESCRIPTION Reading a map is a language composed of lines, colors, and symbols. Five basic colors are used for Topographic Maps. Brown (Contour Lines) Black (Man Made Features, Roads, Trails) Blue (Water Features) Green (Vegetation) Red (Highway and Land Grids) Two minor colors Pink (Built up area, civilization) Purple (Updated Map Information)
Profiles of Topographic Maps • A profile is a side view of something. • There are four main steps required to make a profile of a topographic map.
Step 1 – Draw a straight line through the map and label it with letters at each end; in this case P-Q.
Step 2 – Create a graph with the same numbers as your elevations/contour interval on the Y-axis. Your P-Q line is the X-axis on the graph.
Step 3 –For every contour line that crosses the A-B line, you will plot that elevation as a point on the graph.(In this picture, the person has drawn lines, not just points. Either way is correct.)
Step 4 – Draw a line connecting the tops of your lines/bars on the graph. (If you used points instead of lines, your graph will look like the one on the right.)
PART 1 Basic Land Navigation CONTOUR LINES A=700 ft B=740 ft C=770 ft D=820 ft Contour Interval ~ The contour interval is the distance between each contour line. The contour interval is found along the bottom edge, center of the map. Intermediate Contour ~ a brown line on a topographic map and represents a line of equal elevation. Index Contour ~ a bolder/wider brown line that has the elevation value marked at various intervals as a part of the line. Example: contour is 20 feet interval
PART 1 Basic Land Navigation CONTOUR LINES • There is a dimension to establishing position which does depend on map reading skills. • This is the vertical dimension. On a map it is referred to as “relief”. • Knowledge of the relief of an area is extremely important to a wilderness navigator. • The most graphic technique ever devised to show relief information is the contour line. • If you were to walk a contour line you would never go down hill and never up hill, and eventually you would arrive back where you started.
PART 1 Basic Land Navigation VALLEY
PART 1 Basic Land Navigation DEPRESSION
Terrain Features PART 1 Basic Land Navigation
PART 1 Basic Land Navigation Map Information - Identification CONTOUR LINES Contour Lines on a map Do not show everything. Scan the Landscape, read between the lines.