Topographic Maps
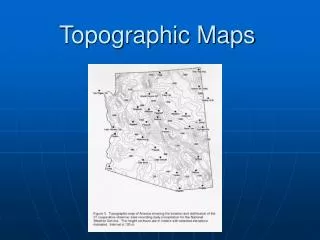
Topographic Maps. I. Topographic Maps. A. Topographic maps show the shape and elevation of the land. B. They also show man-made features such as roads, development, trails, etc. II. Contour Lines. A. Topographic maps use Contour Lines to show elevation and land shape .


Topographic Maps
E N D
Presentation Transcript
I. Topographic Maps A. Topographic maps show the shape andelevation of the land. B. They also show man-made features such as roads, development, trails, etc.
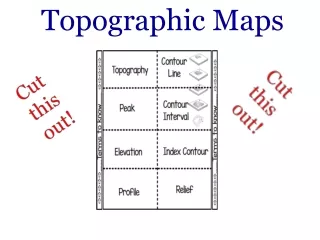
II. Contour Lines A. Topographic maps use Contour Lines to show elevation and land shape. B. A Contour Line is a line on a map that connects places of equal elevation.
C. The Contour Interval is the difference in elevation between two consecutive contour lines D. Index Contour- a contour line that is numbered with the elevation. Contour Interval Contour Interval
0 0 - -
1st: Calculate the difference between the 2 index contours. 2nd:Count the number of contour lines between the 2 index contour lines and add 1. (This is how many “Steps” the elevation has changed) 3rd: Divide the difference calculated in #1 by the number of “steps” figured in #2 and you will get the value of the contour interval. What is the contour Interval?
III. How Topographic Maps are made A. The land is surveyed to find the elevation of the land. B. A contour interval is chosen based on how steep the land is. C. Lines are drawn connecting places with equal elevation.
IV. Interpreting land shape A. Contour lines that are spaced close together show STEEP land. Elevation is increasing over a short distance. B. Contour lines that are spaced far apart show land that is NOTsteep (a gentle slope). Elevation isn’t changing much in a given distance.
VI. Mountains and depressions A. Contour lines form closed circles around mountain peaks. B. An area of depression is indicated with hash marks pointing in on the circle. This indicates that elevation goes down.
VII. Rivers A. Because rivers erode land, the area beside a river has a lower elevation than the land around it. This appears as dips in the contour lines. The point of the dip always points UPSTREAM, or up hill.