Chapter Outline
Chapter Outline. Bonds and Bond Valuation More on Bond Features Bond Ratings Some Different Types of Bonds Bond Markets Inflation and Interest Rates Determinants of Bond Yields. Bond Definitions. Bond Par value (face value) Coupon rate Coupon payment Maturity date

Chapter Outline
E N D
Presentation Transcript
Chapter Outline • Bonds and Bond Valuation • More on Bond Features • Bond Ratings • Some Different Types of Bonds • Bond Markets • Inflation and Interest Rates • Determinants of Bond Yields
Bond Definitions • Bond • Par value (face value) • Coupon rate • Coupon payment • Maturity date • Yield or Yield to maturity
Present Value of Cash Flows as Rates Change • Bond Value = PV of coupons + PV of par • Bond Value = PV annuity + PV of lump sum • Remember, as interest rates increase the PV’s decrease • So, as interest rates increase, bond prices decrease and vice versa
Valuing a Discount Bond with Annual Coupons • Consider a bond with a coupon rate of 10% and coupons paid annually. The par value is $1000 and the bond has 5 years to maturity. The yield to maturity is 11%. What is the value of the bond? • Using the formula: • B = PV of annuity + PV of lump sum • B = 100[1 – 1/(1.11)5] / .11 + 1000 / (1.11)5 • B = 369.59 + 593.45 = 963.04 • Using the calculator: • N = 5; I/Y = 11; PMT = 100; FV = 1000 • CPT PV = -963.04
Valuing a Premium Bond with Annual Coupons • Suppose you are looking at a bond that has a 10% annual coupon and a face value of $1000. There are 20 years to maturity and the yield to maturity is 8%. What is the price of this bond? • Using the formula: • Using the calculator:
Bond Prices: Relationship Between Couponand Yield • If YTM = coupon rate, then par value = bond price • If YTM > coupon rate, then par value > bond price • Why? • Selling at a discount, called a discount bond • If YTM < coupon rate, then par value < bond price • Why? • Selling at a premium, called a premium bond
Interest Rate Risk • Price Risk • Change in price due to changes in interest rates • Long-term bonds have more price risk than short-term bonds • Reinvestment Rate Risk • Uncertainty concerning rates at which cash flows can be reinvested • Short-term bonds have more reinvestment rate risk than long-term bonds
Computing Yield-to-maturity • Yield-to-maturity is the rate implied by the current bond price • Finding the YTM requires trial and error if you do not have a financial calculator and is similar to the process for finding r with an annuity • If you have a financial calculator, enter N, PV, PMT and FV, remembering the sign convention (PMT and FV need to have the same sign, PV the opposite sign)
YTM with Annual Coupons • Consider a bond with a 10% annual coupon rate, 15 years to maturity and a par value of $1000. The current price is $928.09. • Will the yield be more or less than 10%?
YTM with Semiannual Coupons • Suppose a bond with a 10% coupon rate and semiannual coupons, has a face value of $1000, 20 years to maturity and is selling for $1197.93. • Is the YTM more or less than 10%? • What is the semiannual coupon payment? • How many periods are there? • What is yield to maturity?
Bond Pricing Theorems • Bonds of similar risk (and maturity) will be priced to yield about the same return, regardless of the coupon rate • If you know the price of one bond, you can estimate its YTM and use that to find the price of the second bond • This is a useful concept that can be transferred to valuing assets other than bonds
Bond Prices with a Spreadsheet • There is a specific formula for finding bond prices on a spreadsheet • PRICE(Settlement,Maturity,Rate,Yld,Redemption,Frequency,Basis) • YIELD(Settlement,Maturity,Rate,Pr,Redemption, Frequency,Basis) • Settlement and maturity need to be actual dates • The redemption and Pr need to given as % of par value • Click on the Excel icon for an example
Debt Not an ownership interest Creditors do not have voting rights Interest is considered a cost of doing business and is tax deductible Creditors have legal recourse if interest or principal payments are missed Excess debt can lead to financial distress and bankruptcy Equity Ownership interest Common stockholders vote for the board of directors and other issues Dividends are not considered a cost of doing business and are not tax deductible Dividends are not a liability of the firm and stockholders have no legal recourse if dividends are not paid An all equity firm can not go bankrupt Differences Between Debt and Equity
The Bond Indenture • Contract between the company and the bondholders and includes • The basic terms of the bonds • The total amount of bonds issued • A description of property used as security, if applicable • Sinking fund provisions • Call provisions • Details of protective covenants
Bond Characteristics and Required Returns • The coupon rate depends on the risk characteristics of the bond when issued • Which bonds will have the higher coupon, all else equal? • Secured debt versus a debenture • Subordinated debenture versus senior debt • A bond with a sinking fund versus one without • A callable bond versus a non-callable bond
Bond Ratings – Investment Quality • High Grade • Moody’s Aaa and S&P AAA – capacity to pay is extremely strong • Moody’s Aa and S&P AA – capacity to pay is very strong • Medium Grade • Moody’s A and S&P A – capacity to pay is strong, but more susceptible to changes in circumstances • Moody’s Baa and S&P BBB – capacity to pay is adequate, adverse conditions will have more impact on the firm’s ability to pay
Bond Ratings - Speculative • Low Grade • Moody’s Ba, B, Caa and Ca • S&P BB, B, CCC, CC • Considered speculative with respect to capacity to pay. The “B” ratings are the lowest degree of speculation. • Very Low Grade • Moody’s C and S&P C – income bonds with no interest being paid • Moody’s D and S&P D – in default with principal and interest in arrears
Government Bonds • Treasury Securities • Federal government debt • T-bills – pure discount bonds with original maturity of one year or less • T-notes – coupon debt with original maturity between one and ten years • T-bonds coupon debt with original maturity greater than ten years • Municipal Securities • Debt of state and local governments • Varying degrees of default risk, rated similar to corporate debt • Interest received is tax-exempt at the federal level
Example 7.3 • A taxable bond has a yield of 8% and a municipal bond has a yield of 6% • If you are in a 40% tax bracket, which bond do you prefer? • 8%(1 - .4) = 4.8% • The after-tax return on the corporate bond is 4.8%, compared to a 6% return on the municipal • At what tax rate would you be indifferent between the two bonds? • 8%(1 – T) = 6% • T = 25%
Zero-Coupon Bonds • Make no periodic interest payments (coupon rate = 0%) • The entire yield-to-maturity comes from the difference between the purchase price and the par value • Cannot sell for more than par value • Sometimes called zeroes, or deep discount bonds • Treasury Bills and principal only Treasury strips are good examples of zeroes
Floating Rate Bonds • Coupon rate floats depending on some index value • Examples – adjustable rate mortgages and inflation-linked Treasuries • There is less price risk with floating rate bonds • The coupon floats, so it is less likely to differ substantially from the yield-to-maturity • Coupons may have a “collar” – the rate cannot go above a specified “ceiling” or below a specified “floor”
Bond Markets • Primarily over-the-counter transactions with dealers connected electronically • Extremely large number of bond issues, but generally low daily volume in single issues • Makes getting up-to-date prices difficult, particularly on small company or municipal issues • Treasury securities are an exception
Bond Quotations • Highlighted quote in Figure 7.3 • ATT 6s09 6.4 177 93 7/8 + ¼ • Company: AT&T • Coupon rate: 6%; coupon payment per year = $60 • Bond matures in 2009 • Current yield = 6.4%; computed as annual coupon divided by current price • Bonds traded: 177 • Quoted price: 93 7/8% of face value, so if face value is 1000, the price is $938.75. It is important to emphasize that bond prices are quoted as a percent of par, just as the coupon is quoted as a percent of par. • Price change: increase by ¼ percent, so the dollar change is .0025(1000) = $2.50
Treasury Quotations • Highlighted quote in Figure 7.4 • 8 Nov 21 125:05 125:11 -46 5.86 • Coupon rate = 8% • Matures in November 2021 • Bid price is 125 and 5/32 percent of par value. If you want to sell $100,000 par value T-bonds, the dealer is willing to pay 1.2515625(100,000) = $125,156.25 • Ask price is 125 and 11/32 percent of par value. If you want to buy $100,000 par value T-bonds, the dealer is willing to sell them for 1.2534375(100,000) = $125,343.75 • The difference between the bid and ask prices is called the bid-ask spread and it is how the dealer makes money. • The price changed by 46/32 percent or $1437.50 for a $100,000 worth of T-bonds • The yield is 5.86%
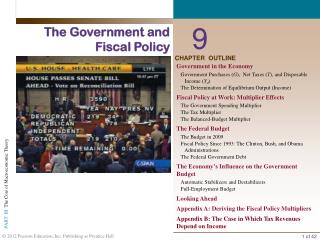
Inflation and Interest Rates • Real rate of interest – change in purchasing power • Nominal rate of interest – quoted rate of interest, change in purchasing power and inflation • The ex ante nominal rate of interest includes our desired real rate of return plus an adjustment for expected inflation
The Fisher Effect • The Fisher Effect defines the relationship between real rates, nominal rates and inflation • (1 + R) = (1 + r)(1 + h), where • R = nominal rate • r = real rate • h = expected inflation rate • Approximation • R = r + h
Example 7.6 • If we require a 10% real return and we expect inflation to be 8%, what is the nominal rate? • R = (1.1)(1.08) – 1 = .188 = 18.8% • Approximation: R = 10% + 8% = 18% • Because the real return and expected inflation are relatively high, there is significant difference between the actual Fisher Effect and the approximation.
Term Structure of Interest Rates • Term structure is the relationship between time to maturity and yields, all else equal • It is important to recognize that we pull out the effect of default risk, different coupons, etc. • Yield curve – graphical representation of the term structure • Normal – upward-sloping, long-term yields are higher than short-term yields • Inverted – downward-sloping, long-term yields are lower than short-term yields
Factors Affecting Required Return • Default risk premium – remember bond ratings • Taxability premium – remember municipal versus taxable • Liquidity premium – bonds that have more frequent trading will generally have lower required returns • Anything else that affects the risk of the cash flows to the bondholders, will affect the required returns
Stock Valuation • Understand how stock prices depend on future dividends and dividend growth • Be able to compute stock prices using the dividend growth model • Understand how corporate directors are elected • Understand how stock markets work • Understand how stock prices are quoted
Cash Flows for Stockholders • If you buy a share of stock, you can receive cash in two ways • The company pays dividends • You sell your shares, either to another investor in the market or back to the company • As with bonds, the price of the stock is the present value of these expected cash flows
One Period Example • Suppose you are thinking of purchasing the stock of Moore Oil, Inc. and you expect it to pay a $2 dividend in one year and you believe that you can sell the stock for $14 at that time. If you require a return of 20% on investments of this risk, what is the maximum you would be willing to pay?
Three Period Example • Finally, what if you decide to hold the stock for three periods? In addition to the dividends at the end of years 1 and 2, you expect to receive a dividend of $2.205 at the end of year 3 and a stock price of $15.435. Now how much would you be willing to pay? (d2=2.1) • PV = 2 / 1.2 + 2.10 / (1.2)2 + (2.205 + 15.435) / (1.2)3 = 13.33 • Or CF0 = 0; C01 = 2; F01 = 1; C02 = 2.10; F02 = 1; C03 = 17.64; F03 = 1; NPV; I = 20; CPT NPV = 13.33
Developing The Model • You could continue to push back when you would sell the stock • You would find that the price of the stock is really just the present value of all expected future dividends • So, how can we estimate all future dividend payments?
Estimating Dividends: Special Cases • Constant dividend • The firm will pay a constant dividend forever • This is like preferred stock • The price is computed using the perpetuity formula • Constant dividend growth • The firm will increase the dividend by a constant percent every period • Supernormal growth • Dividend growth is not consistent initially, but settles down to constant growth eventually
Zero Growth • If dividends are expected at regular intervals forever, then this is like preferred stock and is valued as a perpetuity • P0 = D / R • Suppose stock is expected to pay a $0.50 dividend every quarter and the required return is 10% with quarterly compounding. What is the price?
Dividend Growth Model • Dividends are expected to grow at a constant percent per period. • P0 = D1 /(1+R) + D2 /(1+R)2 + D3 /(1+R)3 + … • P0 = D0(1+g)/(1+R) + D0(1+g)2/(1+R)2 + D0(1+g)3/(1+R)3 + … • With a little algebra, this reduces to:
DGM – Example 1 • Suppose Big D, Inc. just paid a dividend of $.50. It is expected to increase its dividend by 2% per year. If the market requires a return of 15% on assets of this risk, how much should the stock be selling for?
DGM – Example 2 • Suppose TB Pirates, Inc. is expected to pay a $2 dividend in one year. If the dividend is expected to grow at 5% per year and the required return is 20%, what is the price?
Stock Price Sensitivity to Dividend Growth, g D1 = $2; R = 20%
Stock Price Sensitivity to Required Return, R D1 = $2; g = 5%
Example 8.3 Gordon Growth Company - I • Gordon Growth Company is expected to pay a dividend of $4 next period and dividends are expected to grow at 6% per year. The required return is 16%. • What is the current price?
Example 8.3 – Gordon Growth Company - II • What is the price expected to be in year 4? • What is the implied return given the change in price during the four year period? • The price grows at the same rate as the dividends