Download
1 / 26
260 likes | 291 Vues
Explore the competitive landscape and cooperation potential in the oil and gas industry chains of major OBOR countries. This research analyzes industry chain competitiveness, market structures, and China's trade position. Findings reveal factors influencing competitiveness and potential collaboration strategies for mutual benefit.

E N D
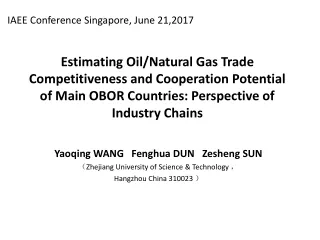
IAEE Conference Singapore, June 21,2017 Estimating Oil/Natural Gas Trade Competitiveness and Cooperation Potential of Main OBOR Countries: Perspective of Industry Chains Yaoqing WANG Fenghua DUN Zesheng SUN (Zhejiang University of Science & Technology , Hangzhou China 310023 )
1.Introduction The Belt and Road Initiative (OBOR) was put forward in 2013, and OBOR countries occupy the biggest share of global oil and gas resource. Oil/gas industry was viewed as one of the most important industry to cooperate between China and OBOR countries. Beyond the increasing constraints in oil/gas exploration & production investment, industrial chain cooperation including refining, petrochemical and synthetic sectors receive more welcome from most OBOR countries. Very few literatures empirically study OBOR’s oil/gas trade competitiveness and cooperation potential from the perspective of industry chain.
Oil/Natural Gas Reforming Pyrolysis light oil Reforming Pyrolysis gas Ethyne Butylene Propylene Ethylene …… Dimethylbenzene Methylbenzene Benzene Oil refining (distillation) Petrochemical (pyrolysis) Compound Compound Synthetic Rubber Synthetic Resin (Plastic) Synthetic Fiber Organic Chemicals Energy Fuel Figure 1. The composition of the oil industry chain Light oil Heavy oil Diesel oil Kerosene Gasoline petrochemical gas
1.Introduction The oil/Gas industrial chain has characteristics of the internal economies of scale and the external economies of scale. The integrated trend of refining and petrochemical industry coexist with China's divesified economy of scale and huge market capacity. To reduce logistics cost and share raw material supply, petrochemical industrial parks and industrial agglomeration was observed to take advantage of external economies of scale. This paper measures, internationally compares and review 13 major OBOR countries' trade competitiveness and cooperation potential from perspective of industry chain.
2. Dataand Methods OBOR includes 64 countries in southeast Asia, south Asia, west Asia and north Africa, central and eastern Europe and central Asia, Mongolia and Russia is also included. We select 13 main countries including oil/gas exporter, consumer, and transit according to the economy size, resources, political stability, population, and bilateral relation. 2001-2015 annual data was used to carry out the empirical research.
2. Dataand Methods The oil and gas industry chain is divided into three parts: crude oil and refined oil, organic chemicals(olefins and aromatics), and synthetic materials(resins, rubber and fibers). Sample OBOR countries include four subgroups: major importer(China and India ); major exporter(Russia, Saudi Arabia, Iran and Kazakhstan), major oil/gas channel countries(Turkey, Pakistan, and Myanmar ), and medium-sized producer(Malaysia, Thailand, Egypt and Indonesia).
2. Dataand Methods In this paper,the trade competitiveness index(TC index), revealed comparative advantage index(RCA index) and international market share(MOR index) are utilized to measure degree of competitiveness. Industry concentration ratio (CRn), and Herfindahl-Hirschman index (HHI) are introduced to measure the distribution and market competitive characteristics of oil/gas industry chain. China's trade share to major OROB countries(TSChina) to measure China's trade position and review the cooperation potential.
3. Result a. Olefin TCindex
Figure 2. Sample countries combined market share and China's share change (%)
Table 5. industry chain competitiveness and comparative advantage summary
Table 5. industry chain competitiveness and comparative advantage summary
4. Further Estimation and Discussion Competitiveness differences in oil/gas industry chain: Oil and natural gas: factor endowment advantage, Russia, Saudi Arabia, Iran and Kazakhstan Oil refining sector: capital elements and locational factors become stronger, China, India and Thailand; Petrochemical sectors: Abundance of capital and technology elements, Russia, Saudi Arabia; but main exporters of organic chemicals and synthetic rubber, Korea, Japan, and the United States, are outside OBOR Synthetic resin and fibre: Capital and labor factors, oil importers, channel countries and medium-sized producers.
Table 6. Market structure and OBOR ’s positionin China’s oil/gas industry chain trade (%)
Table 7. China’s position to OBOR countries in oil/gas industry chain trade(2015,%)
OBOR’soil/gas cooperation potential Traditional cooperation: matching supply and demand, and demand alliance. Industry chain cooperation: Embedding mutual competitiveness and the matching of comparative advantage. Diversified economies of scale technology matching cooperation: China’s different economies of scale in refining technology, abundant capital and refining capacity can be used to embed different OBORcountries. Market and financial cooperation: China’s huge market size and abundant capital. China's cooperation with Russia in synthetic rubber sector is a good case.
5. Conclusions Countries like China and India have disadvantages in crude oil, gas and refined oil. Their competitiveness mainly lie in the downstream sectors, especially in synthetic fiber. Major exporters have competitiveness in crude oil and gas, with Russia and Saudi Arabia being competitive in organic chemicals and certain synthetic materials, but lacking competitiveness/comparative advantage in synthetic fiber. Channel countries have weak competitiveness in oil/gas industry chain except comparative advantages in synthetic fiber. Medium-sized producers do not show strong competitive and comparative advantage in oil/gas industry chain.
5. Conclusions China ’s position in oil/gas industry chain has generally improved over the past 15 years. OBOR countries ’s position in China’s trade is the highest for crude oil and natural gas sector, while being lower for organic chemicals and synthetic materials. From perspective of OBOR countries, China’s importance in export was in crude oil and natural gas sector; and in import trade, synthetic fibre and synthetic resin isimportant. OBOR oil/gas industry chain cooperation should pay more attention to the embedding of competitiveness and the matching of comparative advantage, which include refining and petrochemical industry between China and other OROB countries.