Data Flow Diagram (DFD) Review
Data Flow Diagram (DFD) Review. Learning Objective. This collection of slides will review the technique of drawing data flow diagrams. What is a Data Flow Diagram?.

Data Flow Diagram (DFD) Review
E N D
Presentation Transcript
Data Flow Diagram(DFD)Review Learning Objective This collection of slides will review the technique of drawing data flow diagrams.
What is a Data Flow Diagram? • A data flow diagram (DFD) is a graphical tool that allows system analysts (and system users) to depict the flow of data in an information system. • The DFD is one of the methods that system analysts use to collect information necessary to determine information system requirements.
What is a Data Flow Diagram? • A Data Flow Diagram is intended to serve as a communication tool among • systems analysts • end users • data base designers • system programmers • other members of the project team
Why Draw Data Flow Diagrams? • To clearly and concisely communicate the flow of data through a system. • Why use a DFD and not just text? • “Since we previously had no way of showing a tangible model, we have had to build the next best thing, which is to use English narrative to describe the proposed system. Can you imagine spending five years’ salary on a custom built house on the basis of an exhaustive narrative description of how the house will be built? ... If you use English to describe a complex system... the result takes up so much space that it’s hard for the reader to grasp how the parts fit together (Gane and Sarson, Structured System Analysis, 1974) • DFD’s are easier to understand than text.
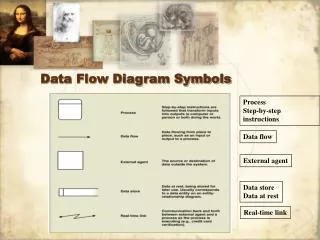
DFD Symbols and Definitions • Process - performs some action on data, such as creates, modifies, stores, delete, etc. Can be manual or supported by computer. • Data store - information that is kept and accessed. May be in paper file folder or a database. • External entity - is the origin or destination of data. Entities are external to the system. • Data flow - the flow of data into or out of a process, datastore or entity Process Data store External Entity Data flow
Rules for Drawing DFD’s A minimum of one data flow in and one data flow out of a process A datastore must be connected to a process (either in, out, or both) An external entity must be connected to a process (either in, out, or both) A single data flow must only flow one way
DFD: Common Mistakes • Process has no data flowing into it, but has data flowing out. • Data store is hooked to external entity. This means external entity can read and write to your data file without auditing!! • The data flow goes in two directions at once. Two or more arrows should be used to show the flow to and from each process.
DFD Example 1 • The Broadway Entertainment Company • An important first step to consider is to look at the key processes under study. These can be itemized into a hierarchical series, where the highest level (level 0) describes a general department, or business unit, to the lowest level. The lowest level is a point where you cannot break a process into any more divisible components. These are referred to as functional primitives.
DFD: Adding Levels of Detail • The highest level, called the context diagram, is only an overview. More detail is typically needed for system analysts. • We add detail to a DFD by creating “levels”. The first level added after the context diagram is called level “0”. • Each new level breaks apart one process and “decomposes” the single process into a new, more detailed DFD. A complete DFD can have many (up to 6 or 7) levels depending on the complexity of system. • Breaking the DFD into levels is referred to as “Decomposition”.
DFD: Numbering Levels • In a DFD with many levels it’s easy to forget which level you are on. That’s why each level has different numbering for the processes on the diagram. The ‘level’ corresponds to the number of decimal places required to define a process in it. Here’s how it works: • Context Diagram Process labeled “0” • Level 0 Processes labeled 1.0, 2.0, 3.0, . • Level 1 Processes labeled 1.1, 1.2, 1.3, . • Level 2 Processes labeled 1.11, 1.12,...
Level 1: Rental(note this is the primitive level for this series of processes)
DFD Levels: Context Diagram • First we can start to draw a general overview. This general overview is called a “Context Diagram”. • A Context Diagram shows three things: • all external entities • a single process labeled “0”that represents the entire system (food ordering system) • the major information flows between the external entities and the system.
DFD Levels: Context Diagram • It would be impossible to understand all of the data flows, and to identify all of the ‘external entities’ relating to our information system in one pass, so we tend to draw DFD’s incrementally.
Building a DFD • We tend to start at the context level, break processes down to Level 0, and then start to consider where data enters and exits our information system, where it is stored, and how a process converts it from one form to another. We are interested here in the movement of data and its conversion.
Building a DFD • Note that a DFD is NOT time-sensitive, and that it is NOT a flowchart. It simply shows how and where data itself progresses through our system. • There are other ways to add information to a chart, such as what departments are responsible for certain activities, or which is batch, realtime, etc.
DFD: Logical vs Physical • Note that the Context Diagram did NOT record the movement of merchandise, but rather the information flow surrounding the underlying business processes. • A DFD that shows the movement of information is called a “logical” DFD. • A DFD that shows the movement of physical stuff (such as merchandise) is called a “physical” DFD. • The logical DFD is by far the most common type of DFD and therefore we will focus on this in this class.
DFD for Broadway • Corresponding to the Process Structure Charts previously outlined, Broadway’s DFD can be drawn as per the following charts:
Context Level(note there are no storage elements at this level)
DFD: Some Final Notes • How many processes on a diagram? • rule of thumb is to have 5 - 7 processes, if you need more, create a new level. • Are there conventions for naming objects? • process names are verb phrases • all others are noun phrases • How many levels should you go? • Only as many as you need to communicate adequately. The key is efficient communication.
What have we learned? • What is a DFD and Why do we use DFD’s? • What are the rules for drawing DFD? • What is a Context Diagram? • What is the difference between logical and physical DFD? • What is a Level 0 DFD? • What is balancing and decomposition?
Epilogue • The Broadway Entertainment Company DFD was created with the IBM Case tool – Rationale Rose