Download
1 / 50
500 likes | 645 Vues
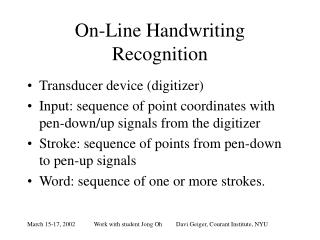
The Impact of Poor Handwriting on Written Composition at 11 and 16 Angela Webb. Handwriting Matters Conference Wales Cardiff University 9 th May 2014. Background. Teachers often report that children with handwriting difficulties produce weaker stories than their peers.

E N D
The Impact of Poor Handwriting on Written Composition at 11 and 16Angela Webb Handwriting Matters Conference Wales Cardiff University 9th May 2014
Background • Teachers often report that children with handwriting difficulties produce weaker stories than their peers. • A strong correlation has been found between handwriting fluency and general written composition quality (Christensen, 2005; Connelly, 2011; Webb, 2005). • This has been interpreted through a theory of ‘Limited Cognitive Capacity’ (Dellerman et al, 1996; McCutchen, 2000). • Improving handwriting fluency has been shown to have beneficial effects upon text generation and composition quality (Berninger et al, 1997, 2002; Graham et al, 2000; Christensen, 2005).
The Simple View of Writing Translation Words, sentences, paragraphs. Working memory Transcription Handwriting, keyboarding, Spelling. Executive functions Planning, review Adapted from Berninger & Amtmann (2003)
“Capacity theory” • Working memory is both limited and vulnerable to disruption. • The many sub-processes of writing compete for cognitive resources. • Transcription processes which are not automatic impose high resource costs and may divert vital cognitive resources away from other writing processes (Berninger & Swanson, 1994; Bourdin et al, 1996; Olive & Kellogg, 2002).
Typically, the demands of handwriting decrease with age as writers become more fluent (Fayol, 2009). Handwriting should be near automatic by 11 years. For children with learning difficulties the demands of transcription may persist for longer (Graham,1990). The aims of handwriting intervention, therefore, should be to reduce the load it places on limited resources (Torrance & Galbraith, 2006).
Longitudinal studies of handwriting • Handwriting difficulties have been found to persist for at least two years in the primary school (Hamstra-Bletz and Blote, 1993; Harvey and Henderson, 1997; Smits-Engelsmann and Van Galen,1997). • No studies have been found showing whether they continue into adolescence. • Also, there are none that show whether the relationship with written composition quality persists, and what form it takes.
Aims To find out whether: • the handwriting and written composition difficulties identified at the top of the primary school persist into adolescence. • the nature of the relationship between the physical act of putting pen to paper and the compositional quality of what is produced changes over time.
Method at T1 Participants • 12 children with teacher-referred handwriting difficulties (6 girls, 6 boys) • Years 5 and 6 in mainstream primary schools • Age (mean = 10.6; SD = 0.5) • 12 age, ability and gender matched controls • N = 24
Standardised measures • Verbal IQ: WISC III-R (short form) (Wechsler, 1994) • Word reading and spelling: BAS II (Elliott, 1996), • Reading comprehension: NARA II (Neale, 1997), • Motor ability: Movement ABC (Henderson & Sugden, 1992); Movement ABC-2 (Barnett, Henderson & Sugden, 2007).
Summary of results Verbal IQ All 12 target children were at least of average ability: 8 scored in the superior range; 4 in the average/high average range. Literacy 11/12 children scored within the normal range or above on word reading, spelling and reading comprehension; one scored 2 SDs below the mean on all 3 measures. Motor ability All 12 target children showed some motor impairment on the MABC: 10 < 5% percentile; 2 = 5 - 15%.
Narrative task Children were instructed to compose a narrative to a picture stimulus in two modes: handwritten and oral. Time limit = 30 minutes. Scripts were transcribed into typed form then assessed for: • text length (number of words) • production speed (words-per-minute) • handwriting quality (where relevant, independently rated) • composition quality (independently rated)
Example 1 (Rated 1 point) “One day there was an egg and it hatched out then it went to see the people and the people got scared but two people saw him but it didn’t see them then he did and they played football and then some people caught them. the end.”
Example 2 (Rated 5 points) “Up, high in the mountains of a small town, something no one has ever seen before is about to be born. For, settled in a crack in the mountain, is a golden egg. CRACK! The egg begins to crack. CLICK! The pieces of eggshell have fallen out of place and a dragon is born. The dragon wondered, “Where are my parents?’ He waited patiently for a hundred years, then decided to leave the mountain. Down he went, past a desert and through a river and there lay a town. The dragon had travelled far and now was searching for food. The dragon ate two people straightaway. He liked them and decided that this was his favourite dish. The townspeople were terrified. They didn’t know what to do. But then a smart boy had an idea. He got some scarecrows from his farm, took out the hay and replaced it with stones. “Hey, dragon!” shouted the boy, “Try this.” The boy threw the scarecrows at the dragon and ran. “Yum”, said the dragon, “more people to eat.” The dragon gobbled up the scarecrows and then had terrible bellyache. “Yuck”, said the dragon, “people are not my favourite dish after all” and he left the town snorting.”
Data analysis Scripts were rated blind to gender, group and mode of production, using a holistical measure for handwriting quality and composition quality. A 6-point Likert scale (1 = poorest; 6 = best) Raters were independent educational psychologists.
Statistical analysis • A repeated measures ANOVA was conducted on parametric data with one between-subjects factor (group) with two levels (target and control) and one within-subject factor (mode) with two levels mode (written and oral). • On non-parametric data independent t-tests were conducted.
Summary of results for handwritten narratives at T1 * significant at the 0.05 level (2-tailed)
Number of words produced in written and oral mode by target and controls No significant main effect of group (F (1,22) = 0.13, ns) or mode (F (1,22) = 0.13, p = .719 ns) but the group x mode interaction was significant (F (1,22) = 13.23, p = .001).
Composition quality in written and oral mode for target and controls Results of the Mann-Whitney U test showed a significant difference between groups for the handwritten scripts (U = 36.5, p = < .05) but not for oral scripts (U = 57.5, ns). The difference between modes was significant for the target group (Z = -2.12, p < .002) but not for the controls (Z = -.95, ns).
Analytic ratings for composition quality Scripts were then rated blind on 5 measures of composition quality from WOLD (Rust 1996): • Generation and development of ideas • Organisation, cohesion and unity • Vocabulary • Sentence structure • Grammar and usage
Analytic data on written composition quality ** significant at the 0.01 level (2-tailed).
Analytic data on written and oral composition quality for target group ** significant at the 0.01 level (2-tailed).
Correlational data for handwritten narratives at T1 * significant at the 0.05 level (2-tailed). ** significant at the 0.01 level (2-tailed).
General summary at T1 • Target group wrote significantly less less than the controls and less than they spoke. • HW speed difference between groups was not significant (though there was a high degree of variability within the target group). • HW quality was poorer in the target group than controls. • Composition quality was also poorer than controls and as weaker in written than in oral, but only in thegeneration and development of ideas. • Strong correlations were found between the amount of text produced, HW quality and handwritten composition quality.
T2 (5 years later)
Method • Same 12 target children (6 girls, 6 boys) • Years 10 and 11 in mainstream secondary schools • Age (mean = 15.5; SD = 0.5) • Same age, ability and gender matched controls • N = 24
Interventions:number of children receiving help(data from parental questionnaire)
Standardised measures at T2 • Verbal IQ: WISC III-R (short form) (Wechsler, 1994) • Word reading, reading comprehension and spelling: BAS II (Elliott, 1996), • Motor ability: Movement ABC-2 (Henderson, Sugden & Barnett, 2007) • Handwriting speed: DASH (Barnett et al, 2007)
Standard scores for target group and controls at T1 and T2 VIQ Reading Reading comprehension Spelling * Significant to .05
Percentile scores for MABC-2 and DASH at T2 ** ** MABC-2 DASH ** significant at the 0.01 level (2-tailed)
Narrative task: handwritten and oral modes “My Ideal Home” – WOLD (Rust, 1996) “Imagine you could could have someone to design a place for you to live and create it to your exact wishes. Write a letter to that person describing how you want it to look. Include all the details that person would need to know.” Time limit 15 minutes.
Narrative samples • Example 1 (Rated 1 point) “My house will be a penthouse flat in docklands with four bedrooms and modern fittings.” • Example 2 (Rated 2 points) “ I would like the house to have 5 floors, 2 bathrooms, 2 living rooms, 2 kitchens, 2 bedrooms, 1 spare room, 2 lofts, 2 swimming pools, one indoor and one outdoor, a pond that goes round the whole house, a built-in barbeque, a green house, a fountain, tables and chairs and a waterfall.”
Example 3 (Rated 6 points) “… I want an art studio, big and gleaming white – pristine and full of light. I want gardens, too, one at the front of the house and one at the back, which are large and green with a wooden porch and small marble rabbits running through wild shrubs. I want an artificial lake with a pontoon guesthouse barge in the centre, lily pads afloat and any other sort of water plants you can find. The water must be crystal clear and I only want the most exotic of fish, pearly-eyed with long, ornate fins. I want a beautiful bridge, wooden with some sort of majestic balance, almost as if it were floating in mid-air. I would also like a garden on the roof with a pond and small, sleek, quaint benches with Moroccan stools and beanbags. I want a very African theme for the décor of my house. Lanterns will hang from every ceiling. I am very particular about lighting – I like romantic shades of pink, and fiery gold. Dark is something that won’t exist in my house! ...”
Data analysis Scripts were again transcribed into typed form then assessed blind by independent raters for: • text length (number of words) • production speed (wpm) • handwriting quality (where relevant) • composition quality (holistic and analytic)
Summary of results for handwritten narratives at T1 and T2 * significant at the 0.05 level (2-tailed)
Number of words written for target and controls at T1 and T2 No significant main effects of group (F (1,23) = 0.70, ns) or of mode (F (1,23) = 0.0, ns) but there was a significant main effect of gender (F (1,23) = 10.2, p < .01) and of time (F (1,23) = 58.83, p < .001). A time x group interaction (F (1,23) = 4.88, p < .05): the controls increased more than the target group.
Rated composition quality in both modes for target and controls at T1 and T2 The difference between the target and controls at T2 was not significant in either written (U = 43.00, ns) or oral composition quality (U = 62.00, ns).
Correlational data for handwritten narratives at T1 and T2 * significant at the 0.05 level (2-tailed). ** significant at the 0.01 level (2-tailed).
Analytic data on written composition quality at T1 and T2 * significant at the 0.05 level (2-tailed)
How to interpret these findings? Need to look within the group results for a possible gender effect.
Differences on all measures between girls and boys at T2 * significant at the 0.05 level (2-tailed). ** significant at the 0.01 level (2-tailed)
Summary of differences between girls and boys at T2 • Girls wrote more than boys, they wrote faster, more neatly and produced narratives of higher quality. • The between-group difference in the generation and development of ideas, noted at T1, had disappeared for the target girls at T2. • The between-group difference was still found in the target boys in the generation and development of ideas (Z = -2.24, p < .05) and also in grammar (Z = -2.27, p < .05).
Overall summary • Handwriting quality appeared to have become established by the end of the primary school. • Handwriting speed increased in all children with age. • Overall, the groups did not differ from each other in number of words written and written composition quality during adolescence, but gender was a defining factor. • The target boys at T1 produced stories which were shorter and of poorer quality than the target girls and this remained so at T2.
Discussion • The relationship between handwriting measures and composition quality does persist into adolescence. • Young people whose handwriting had improved had also improved in composition quality. • Those whose handwriting had not improved still produced narratives of poorer composition quality than controls. • Girls in both groups performed better than boys at T2.
Issues for the future • How can the difference in response to intervention between girls and boys be explained? • Sample sizes were small. Need for bigger groups for gender comparison. • Severity and persistence of certain measures, e.g. manual dexterity may be a factor. • Intervention regimes were not controlled. • Literature suggests effective intervention needs to be both intensive and prolonged (Christensen, 2005). • Interventions need to reflect ‘cognitive capacity’ theory.
Acknowledgements Thanks go to: • the 24 young people who agreed to be re-assessed for the study and to their families for accommodating us, • Prof. Morag Stuart and Prof. Sheila Henderson The Institute of Education, London University.
Effect of spelling • Since spelling was found to be poorer in the target group than the controls at T2 a further MANCOVA was conducted on the T2 data alone with this measure as a co-varying factor. Results showed that when spelling was taken into account, the results were similar to those above: i.e. there was no significant group difference (F (1,23) = .10, ns), though the gender difference was still significant (F (1,23) = 7.83, p < .05).
Narrative task: handwritten and oral modes “My Ideal Home” – WOLD (Rust, 1996) “Imagine you could could have someone to design a place for you to live and create it to your exact wishes. Write a letter to that person describing how you want it to look. Include all the details that person would need to know.” Time limit 15 minutes.