Download
1 / 70
700 likes | 877 Vues
Chapter 12 Government Intervention in the Product Market. Contents:. Market Price as a Social Coordinator Government Intervention – Price Ceiling Price Floor Quota Output Tax Subsidy Quality Control. Market Price as a Social Coordinator. What is price?. Price

E N D
Contents: • Market Price as a Social Coordinator • Government Intervention – Price Ceiling • Price Floor • Quota • Output Tax • Subsidy • Quality Control
What is price? • Price • is an exchange ratio showing the actual amount of a commodity (money or another good) that one has to pay in order to obtain a unit of the good. • Nominal(or money or absolute) price • is the exchange ratio expressed in terms of money. • Relative price • is the exchange ratio expressed in terms of another good.
Relation among price, revenue and value • Relation between price and revenue TR = AR = MR: In a price-taking market In a price-searching market
Relation between price and exchange value Exchange value (or market value) of a good = revenue from selling the good or = expenditure on buying the good. MEV: In a price-taking market: = MR = P In a price-searching market: = MR < P
Relation between price and use value Price Use value However, to maximize utility, buyers will consume the quantity at which MUV=P. Price = the maximum amount one is willing to pay for the good at the margin, i.e., MUV.
$ S Equilibrium price Pe D Q Qd=Qs Determination of market price (traditional analysis) Qd>Qs P ; Qd<QsP; Qd=QsP unchanged
Determination of market price (modern analysis) * Market D curve = MUV. Market S curve =MC. * If TC = 0, whenever MUV MC, mutually beneficial trade is possible at a price between MUV & MC, until MUVs = MCs = P and Qd = Qs. * As MCs are equal, MUVs are equated and MUVs = MCs, the market equilibrium is efficient in resource allocation.
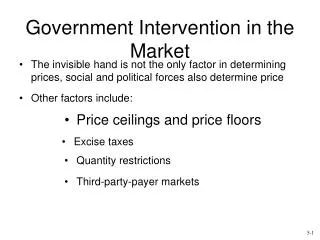
Functions of market price 1. Determine who wins and who loses in a market economy.Only the highest bidder can get the good. 2. Rewards(maximizers)or penalizes(non-maximizers)decisions or performance 3.A signal which transmits information and directs resource allocation.Price is the invisible hand.
What is a price ceiling? Price ceiling • is the maximum price allowed by law; or • is the price fixed below the equilibrium level.
Q12.2 Analyse the effect on the price and the quantity transacted of a good if the maximum price allowed by law (the price ceiling) is set (a) below the equilibrium price; (b) above the equilibrium price.
$ S=MC (Equilibrium price)P0 D=MUV Q Qd1 Qs1 Shortage Graphical illustration (Price ceiling)P1
Effects of price ceiling on a price-taking market falls 1. The price _______ from P0 to P1. increases 2. Quantity demanded ___________ to Qd1. Quantity supplied ___________ to Qs1. A shortage arises = Qd1 – Qs1. decreases falls 3. Quantity transacted _______ to Qs1. Why?
4. Non-price competition exists among buyers • Qs is inadequate and the price is fixed • non-price competition exists among buyers Examples: • First-come, first-served • Ballot • Allocation on the basis of ability • Sellers’ preferences
The maxi. cost one is willing to pay in the non-price competition. $ S=MC D=MUV P1 Q Qs1 Qd1 Shortage • Buyers are willing to pay a maximum non-monetary cost (= MUV - P1). • Full cost = P1 + non-monetary cost.
5. Final allocation • No resale + people have the same ability individuals with higher MUV will get the good. • Why? • No resale + people have different ability individuals who can accomplish higher achievement will get the good (≠highest MUV nor best ability). Why? • Resale • individuals with higher MUV will get the good. • Why?
6. Income redistribution (or wealth transfer) Who gains? • Gov’t officials who execute the price controlWhy? • Winners whose full cost < equilibrium price Who loses? • ProducersWhy? • Winners whose full cost > equilibrium price • Former winners but present losers
$ S=MC Deadweight loss brought by under-production D=MUV (Price ceiling) P1 Q Qd1 Qs1 7. Efficiency loss • Production efficiency(to maximize wealth, producers will produce the goods at the minimum cost) xConsumption efficiency(winners of non-P competition may not be individuals with the highest value) xAllocative efficiency(MUV > MC under-production )
8. Black market in which the good is sold illegally at a price above P1 S=MC $ D=MUV (Price ceiling) P1 Q Qd1 Qs1
9. Reduction in product quality • As Qd > Qs , • many consumers are willing to accept lower quality gds • this induces producers to lower quality, to cut cost and to gain more 10. Drop in the turnover rate of tenants • Rent control shortage of flats • whenever a tenant change his residence, he has to bear a high full cost in order to win the non-P competition turnover rate of tenants drops
Remark: Price ceiling results in shortage & disequilibrium? If we consider the price competition only at the price ceiling (P1), Qd1 > Qs1 shortage & disequilibrium appear To compete for the inadequate Q, a non-P comp. must emerge. If we consider the full cost(P1 + non-monetary cost) full cost & Qd until Qd = Qs (at Qs1) “shortage” vanishes & equilibrium is achieved
Q12.3 Evaluate if the imposition of price ceiling benefits society. Does it lower the price, benefit the poor and achieve efficiency?
$ MC P* D MR Q Qpt Qm Q12.4 (a) If a price ceiling (P*) is imposed on a price-searching market, what will be the shape of the new marginal revenue curve? (b) Find out the equilibrium price and the equilibrium quantity if a price ceiling is set at P*.
What is a price floor? Price floor is the minimum price allowed by law; or is the price fixed above the equilibrium level.
What is a price floor? To be effective, a price floor must be setabovethe equilibrium price. Why?
$ S=MC (Equilibrium price) P0 D=MUV Q 0 Qd2 Qs2 Surplus Graphical illustration (Price floor) P2
Effects of a price floor on a price-taking market rises 1. The price _______ from P0 to P2. decreases 2. Quantity demanded __________ to Qd2. Quantity supplied __________ to Qs2. A surplus arises = Qs2 – Qd2. increases falls 3. Quantity transacted _______ to Qd2. Why?
4. Non-price competition exists among sellers • Inadequate buyers + fixed price • non-P competition exists among sellers $ S=MC • Sellers are willing • to pay a max. cost • (= P2 - MC) to • compete for buyers. (Price floor) P2 D=MUV Q 0 Qd2 Qs2 Surplus
$ S=MC (Price floor) P2 D=MUV Q 0 Qd2 Qs2 Surplus 6. Black market • some units of the good may be sold at a P below P2 illegally. 7. Product quality • Product quality is improved.Why?
$ S’ S=MC P3 MC3 D=MUV Q Q3 Q0 What is a quota? Quota is the maximum quantity supplied allowed by law. • To be effective, quota (Q3) must be set below the equilibrium quantity (Q0).
Effects of quota on a price-taking market 1. The supply curve turns ___________ at Q3. vertical 2. Price ________ to P3, where D meets S. rises 3. Quantity transacted ___________ to Q3. falls ( Options: horizontal / vertical / rises / falls )
S’ $ S=MC P3 Max. unit price of quota MC3 D=MUV Q Q3 Q0 4. Allocation of quota • To compete for the quota, sellers are willing to pay a maximum cost of (P3–MC3) to compete for each unit of quota. • In auction, the quota goes to the highest bidder.
5. Efficiency Loss XProduction efficiency (The goods may not be produced by producers of the lowest cost.) • Consumption efficiency • (The goods are consumed by individuals with • the highest value.) XAllocative efficiency (MUV > MCUnder-production.)
S’ $ S=MC P3 MC3 D=MUV Q Q3 Q0 Graphical illustration: Deadweight loss brought by under-production
TAX TAX TAX Government Firms Commodities Individuals What is a tax? Tax: is a compulsory payment levied on individuals, firms or commodities by the gov’t.
Classification accordingto the tax burden Direct tax taxpayers cannotshift the tax burden to others a tax levied onindividuals, income or wealth Indirect tax taxpayers can shift the tax burden to others a tax levied ongoods and services
Classification according to the tax rate Progressive tax as taxpayer’s income ,tax rate Proportional tax as taxpayer’s income ,tax rate unchanged Regressive tax as taxpayer’s income , tax rate
$ S1 S0 Pb=P1 P0 Ps=P2 D0 Q Q0 Q1 Effects of output tax on a price-taking market (imposed on sellers) tax
Effects of output tax (con’t) 1. The supply curve shifts________ by t. upward rises 2. The market price ______ from P0to P1. The price paid by buyers (Pb) ______ from P0 to P1. The actual price received by sellers (Ps) ______from P0 to P2 (= Pb - t). rises drops drops 3. Quantity transacted______from Q0 to Q1. ( Options: downward / upward / drops / rises )
$ S1 Tax revenue S0 tax Pb=P1 Drop in buyer’s surplus P0 Drop in seller’s surplus Ps=P2 D0 Q Q1 Q0 4. Income distribution
5. Efficiency Loss • Production efficiency • (Goods are produced by producers with the min. cost.) • Consumption efficiency • (Goods are consumed by consumers with the highest value.) XAllocative efficiency (MUV > MC Under-production.)
$ S1 Tax revenue S0 tax Pb=P1 Drop in buyer’s surplus Net social gain < 0 (deadweight loss) P0 Drop in seller’s surplus Ps=P2 D0 Q Q1 Q0 Net social gain = Rise in tax revenue + drop in buyer’s surplus + drop in seller’s surplus
Q12.6 Find out the quantity transacted, the market price, the actual price paid by buyers and the actual price received by sellers (a) if the output tax is imposed on buyers. (b) if the output tax is shared equally between buyers and sellers. Compare the above results with those if the output tax is imposed on sellers.