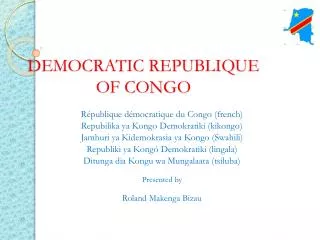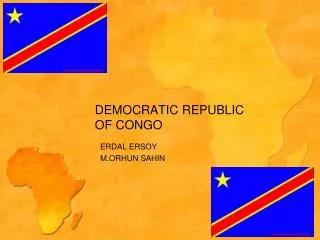
Italy and the Democratic Republic of the Congo (formerly Zaire) Illustrate the Demographic Divide in 2008.
Italy and the Democratic Republic of the Congo (formerly Zaire) Illustrate the Demographic Divide in 2008. Source: Carl Haub and Mary Mederios Kent, 2008 World Population Data Sheet . © 2008 POPULATION REFERENCE BUREAU. Chapter 2 Outline. World Population Growth

Italy and the Democratic Republic of the Congo (formerly Zaire) Illustrate the Demographic Divide in 2008.
E N D
Presentation Transcript
Italy and the Democratic Republic of the Congo (formerly Zaire) Illustrate the Demographic Divide in 2008. Source: Carl Haub and Mary Mederios Kent, 2008 World Population Data Sheet. © 2008 POPULATION REFERENCE BUREAU
Chapter 2 Outline • World Population Growth • Geographic Distribution Of The World’s Population • Global Variation In Population Size And Growth • Global Demographic Contrasts
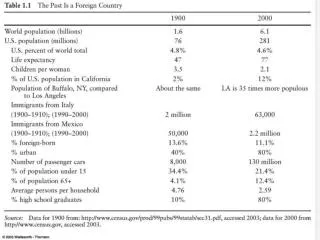
World Population Growth • During the first 90% of human existence, the population of the world had grown only to the size of today’s New York City. • Between 1750 and 1950, the world’s population grew from 800 million to 2.5 billion. • Since 1950 it has expanded to more than six billion.
World Population Growth Through History Billions 12 11 2100 10 9 Modern Age Old 8 Iron Bronze Middle Stone Age New Stone Age Ages Age Age 7 Future 6 2000 5 4 1975 3 1950 2 1900 1 1800 Black Death — The Plague 2000 1+ million 7000 6000 5000 3000 1000 A.D. 4000 A.D. A.D. A.D. A.D. A.D. years B.C. B.C. B.C. B.C. B.C. B.C. B.C. 1 1000 2000 3000 4000 5000 Source: Population Reference Bureau; and United Nations, World Population Projections to 2100 (1998).
Why Was Early Growth Slow? • During the first 99% of human history death rates were high. • During the hunting-gathering phase, life expectancy averaged 20 years. • More than half of children born will died before 5. • The average woman who survived the reproductive years would have to bear nearly 7 children to assure 2 survived to adulthood.
Why Are More Recent Increases so Rapid? • Acceleration in population after 1750 was due to declines in the death rate that accompanied the Industrial Revolution. • People were eating better, wearing warmer clothes, bathing more often and drinking cleaner water. • Continuing population increases are due to dramatic declines in mortality without a commensurate decline in fertility.
Women of Childbearing Age and Fertility Worldwide Source: United Nations, World Population Prospects: The 2002 Revision (medium scenario), 2003.
To Slow Population Growth, Developing Countries’ Fertility Decline Must Be Rapid. Average Lifetime Births per Woman: 1800-2007 Sources: (United States) Ansley Coale and Melvin Zelnik (1963); and National Center for Health Statistics. (Bangladesh) United Nations; Demographic and Health Surveys; and other surveys
Population in Countries With Low Fertility Decline or Growth, 2002-2025 Percent Country (average number of children per woman) China (1.8) South Korea (1.4) Trinidad & Tobago (1.6) Italy (1.2) Russia (1.1) Bulgaria (1.1) Source: United Nations, World Population Prospects: The 2002 Revision (medium scenario), 2003.
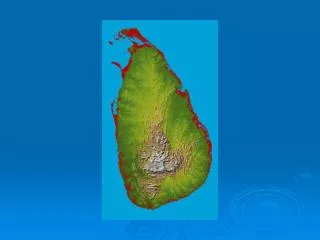
Lavender - 20 and 30 millionPink –10 and 20 millionGrey - 5 and 10 million. Orange –Greater than 100 millionBlue - 50 and 100 millionGreen -40 and 50 millionYellow - 30 and 40 million
Doubling Time • The time required for a population to double if the current rate of growth continues. • The doubling time is approximately equal to 69 divided by the growth rate. • Estimate the world’s rate of growth in the year 2003 to be 1.2% per year, the doubling time is 58 years.
Redistribution of the World’s Population through Migration • Migration streams flow from rapidly growing areas into less rapidly growing ones: • Latin America and Asia to the United States • Asia to Canada • Africa and Asia to Europe • In earlier decades, as population grew dense in a region, people moved to less populated areas.
European Expansion • Europeans began to stake out the less developed areas of the world in the 15th and 16th centuries. • Before this expansion, Europeans represented 18% of the world’s population. • By the 1930s, people of European origin in Europe, North America, and Oceania accounted for 35% of the world’s population.
The Urban Revolution • As recently as 1800, less than 1% of the world’s population lived in cities of 100,000 or more. • More than 1/3 of all humans now live in cities of that size. • Urban populations grew in some countries even without industrialization, as places sprang up where goods and services were exchanged.
World Population Clock 2009 Source: Population Reference Bureau, 2009 World Population Data Sheet.