Download
1 / 1
10 likes | 222 Vues
Implications of Climate Change for Recreation in the United States Sarah Nicholls, Bas Amelung and David Viner. Introduction to Climate Change. Purpose. The world’s climate is changing. According to the Intergovernmental Panel on Climate Change (IPCC, 2001):

E N D
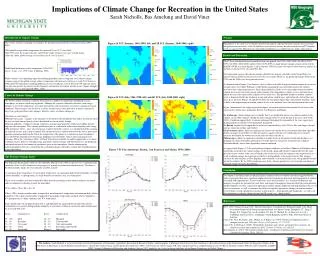
Implications of Climate Change for Recreation in the United States Sarah Nicholls, Bas Amelung and David Viner Introduction to Climate Change Purpose • The world’s climate is changing. According to the Intergovernmental Panel on Climate Change (IPCC, 2001): • The global average surface temperature has increased 0.6 ± 0.2°C since 1861; • The 1990s were the warmest decade, and 1998 the single warmest year, since records began; • Since the 1860s, global average sea level has risen 0.1 to 0.2 meters. • Global land and marine surface temperature, 1856-2004 • (Source: Jones et al., 1999; Jones & Moberg, 2003) • While estimates vary depending upon the modeling procedures and assumptions used, climate change scenarios suggest that global average surface temperature will increase by between 1.4 and 5.8°C between 1990 and 2100. Projections regarding global mean sea level indicate a rise of between 0.09 and 0.88 meters over the same period. An increase in the frequency and intensity of extreme weather events (floods, droughts, heat waves, etc.) is also expected (IPCC, 2001). Figure 1A TCI (January, 1961-1990, left) and 1B TCI (January, 2040-2069, right) The purpose of the study was to identify the potential impacts of projected climate change on recreational and general tourism activity in the United States over the next century, based on calculation of TCI comfort levels as suggested by Mieczkowski. A detailed methodology is available from the authors upon request. Results and Discussion The TCI was calculated for every month for four time periods, the 1970s (1961-1990), the 2020s (2010-2039), the 2050s (2040-2069) and the 2080s (2070-2099). A single climate change scenario (A2A with the HadCM3 GCM) was used. Figures 1 and 2 illustrate TCI levels across the entire United States in January (1) and July (2) for the 1970s (A) and 2050s (B). Our exploration suggests that climate change will affect the climatic suitability of the United States for general tourism and recreation activities over the next century. However, the projected changes between the 1970s and the 2050s vary by region and season. As demonstrated in Figure 1 (for January), there is likely to be little change in outdoor comfort levels in late fall and winter (November-February), with Florida remaining the most desirable location for outdoor activities from a climatic perspective. Early spring (March) is likely to see some improvement in outdoor comfort levels across the entire nation, while summer (June-September) is likely to see a deterioration in almost all areas other than Alaska and parts of the north-west. This probable decline in outdoor comfort levels is demonstrated by the decline in orange and yellow shaded areas, and northwards shift of blue and green areas, between Figures 2A and 2B (for July). In late spring (April, May) and mid-fall (October), there is likely to be improvement in outdoor comfort levels in the northern states, but deterioration in the south. Figure 3 demonstrates the range of potential impacts on tourism and recreation comfort levels across four representative urban areas, Anchorage, Boston, San Francisco and Miami. In Anchorage, climate change may eventually lead to a considerable increase in outdoor comfort in the summer season (May-August), though the index remains below 70 in all but one of the cases (July of the 2080s). Conditions appear likely to remain unchanged throughout the remainder of the year, suggesting a minimal impact on comfort levels throughout that period; In Boston, comfort levels appear likely to decline (considerably by the 2050s) in July and August, though increase somewhat in May and October; San Francisco appears likely to experience an increase in comfort levels year round, other than a possible decline in August in the 2080s. Overall, the analysis suggests that this city will become an even more attractive destination for outdoor recreation activities than it already is; Miami appears likely to experience a decline in comfort levels in all months, though this decline is at a minimum in winter (December and January). Overall, however, the pattern of attractiveness (highest November-March, lowest June-September) remains unaltered. As suggested by Figures 1-3, the most pleasant climatic conditions in the West, Midwest and Northeast have historically occurred in the summer months. In the South, spring and fall have traditionally been the most pleasant seasons (winter in the case of Florida), due to the excessively hot summers often experienced. As a result of climate change, these patterns are likely to shift gradually to the north, however. The summer season in the mid-Atlantic, in New England, and eventually even on the Pacific coast, will gradually become too hot for comfort. By the 2050s Anchorage may, from a climate perspective, be a more pleasant place to spend the month of August than Boston. Causes of Climate Change Figure 2A TCI (July, 1961-1990, left) and 2B TCI (July, 2040-2069, right) The Earth’s climate system is a complex interaction of a number of components including the ocean, atmosphere, ice masses and living organisms. Although the system is ultimately driven by solar energy, changes to any of the components, or to their interactions with one another, can lead to a change in climatic conditions. These changes can occur over a variety of time scales, from short term seasonal variations to long-term (geological time scale) changes. Four key causes of climate change are:Variations in solar output; Milankovitch cycles – changes in the character of the Earth’s orbit around the Sun, and in its rotation, affect the way in which energy from the Sun is distributed by season and by latitude;Volcanic pollution – explosive volcanic eruptions can inject large quantities of dust and sulphur dioxide high into the atmosphere. This volcanic pollution results in a substantial reduction in incoming solar energy; The greenhouse effect – once solar energy has reached the Earth's surface, it is absorbed, thereby warming the land and oceans, and is then re-emitted. The amount of heat re-emitted and eventually lost to space must equal the amount gained from the Sun if the temperature of the planet is to remain constant. Greenhouse gases absorb the outgoing terrestrial energy, trapping it near the Earth's surface and causing increased warming. This is the ‘greenhouse effect.’ Without it the planet would be too cold to support life as we know it. Human society, however, through energy generation, land use change and other processes, has produced a substantial increase in the amount of greenhouse gases in the atmosphere, thereby enhancing the natural greenhouse effect. It is feared that this continuing change will lead to a major shift in global climate, as described above. Figure 3 TCI for Anchorage, Boston, San Francisco and Miami, 1970s-2080s The Tourism Climatic Index The Tourism Climatic Index (TCI) was developed by Mieczkowski (1985) as the first ever evaluation of the suitability of the world’s climates for the purposes of general recreation and tourism activity. The index is based on monthly means for seven climatic variables, namely: (i) maximum daily temperature; (ii) mean daily temperature; (iii) minimum daily relative humidity; (iv) daily relative humidity; (v) precipitation; (vi) daily duration of sunshine; and, (vii) wind speed. These seven variables were then weighted by Mieczkowski according to their relative influence on tourist and recreationalist well-being to form the final index: TCI = 4CID + CIA + 2R + 2S + W Where: CID = daytime comfort index (composed of maximum daily temperature and minimum daily relative humidity); CIA = daily comfort index (composed of mean daily temperature and daily relative humidity); R = precipitation; S = daily sunshine; and, W = wind speed. Each variable takes on an optimal rating of 5.0, and Mieczkowski suggested the classification scheme outlined below be used to distinguish the suitability of a location’s climate for recreation and tourism based on its overall TCI score: Score Comfort level Score Comfort level 90 – 100 Ideal 40 – 49 Marginal 80 – 89 Excellent 30 – 39 Unfavourable 70 – 79 Very good 20 – 29 Very unfavourable 60 – 69 Good 10 – 19 Extremely unfavourable 50 – 59 Acceptable Below 9 Impossible Conclusion The temporal and spatial shifts in optimal climatic comfort levels for outdoor recreation suggested by the analyses presented here have significant implications for the planning, provision and management of outdoor recreation (OR) opportunities. To most effectively serve their customers, it is vital that OR planners and managers recognize the potential for such shifts, and begin to incorporate them into their long-term planning and development activities. A proactive approach to climate change adaptation will help minimize the cost of necessary measures, as well as maximize the ability to capitalize on positive changes in outdoor comfort levels. Future research should focus on finer scaled analyses – both spatially and temporally – as well as on the implications of climate change for specific OR sectors, e.g., skiing or golf. References IPCC (2001) Climate Change 2001: The Scientific Basis. Contribution of Working Group I to the Third Assessment Report of the Intergovernmental Panel on Climate Change, Houghton, J.T., Ding, Y., Griggs, D.J., Noguer, M., van der Linden, P.J., Dai, X., Maskell, K., & Johnson C.A. (eds.), Cambridge University Press, Cambridge, United Kingdom and New York, NY, United States of America. Jones, P.D., New, M., Parker, D.E., Martin, S., & Rigor, I.G. (1999) ‘Surface air temperature and its changes over the past 150 years,’ Reviews of Geophysics, 37, 173-199. Jones, P.D., & Moberg, A. (2003) ‘Hemispheric and large-scale surface air temperature variations: An extensive revision and an update to 2001,’ Journal of Climate, 16, 206-223. Mieczkowski, Z. (1985) ‘The tourism climatic index: A method of evaluating world climates for tourism,’ Canadian Geographer, 29(3), 220-233. The Authors: Sarah Nicholls is an Assistant Professor in the Departments of Community, Agriculture, Recreation & Resource Studies, and Geography, at Michigan State University. Bas Amelung is a Research Associate in the International Centre for Integrative Studies at the University of Maastricht, in the Netherlands. David Viner is a Senior Research Associate in the Climatic Research Unit (CRU) at the University of East Anglia, UK. The work presented was completed during visits to CRU by Nicholls (January-February 2005, funded by an ESRC-SSRC Visiting Collaborative Fellowship) and Amelung (August 2003, funded by the Center for Integrated Study of the Human Dimensions of Global Change ).