Download
1 / 17
170 likes | 292 Vues
Understanding the Impacts of Climate Change on the United States. Dr. Virginia Burkett USGS Chief Scientist for Global Change Research. U.S. Department of the Interior U.S. Geological Survey. Why paleoclimate ?.

E N D
Understanding the Impacts of Climate Change on the United States Dr. Virginia Burkett USGS Chief Scientist for Global Change Research U.S. Department of the Interior U.S. Geological Survey
Whypaleoclimate? The period of time over which we have instrumental records available is very short, and records only Earth’s recent warm climate over a period of relatively stable conditions.
a 65 million year Arctic climate synthesis Temperature and precipitation history Past rates of climate change History of the Greenland Ice Sheet History of Arctic sea ice
A sustained warming of 4° - 13°F over central Greenland will lead to the eventual melting of most of the Greenland Ice sheet. • Arctic amplification has been a pervasive feature of the Earth’s climate system for at least the last 4 million years IPCC 2007
The current rate of human-influenced Arctic warming is comparable to peak natural rates documented by reconstructions of past climates. • The size and speed of summer sea ice loss seen over the past few years is highly anomalous relative to the previous few thousands of years.
-25 -30 warmer YD -35 -40 10°C increase in about a decade at end of Younger Dryas interval (YD) Temperature in Central Greenland (C) -45 -50 colder -55 20 15 10 5 0 Thousands of years before present Abrupt Climate Change Alley, 2000
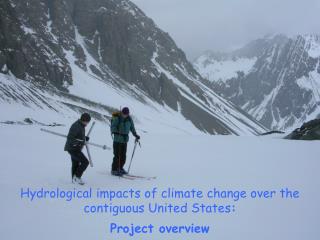
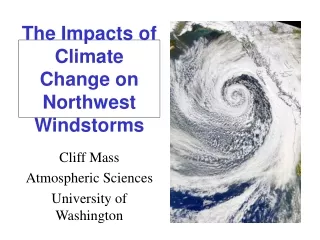
Abrupt Climate Change Will climate response to future greenhouse warming be gradual or abrupt? Muir glacier, AK 1941 & 2004 Photo Credit: Molnia, USGS
Four types of abrupt change stand out in the geologic record as being so rapid and large in their impact that, if they were to recur, they would pose clear risks to society in terms of our ability to adapt. • Rapid change in glaciers, ice sheets, and hence sea level. • Widespread and sustained changes to the hydrologic cycle, primarily drought. • Abrupt change in the Atlantic Meridional Overturning Circulation (AMOC), a critical component of global climate, characterized by the northward flow of warm, salty water in the upper layers of the Atlantic Ocean. • Rapid release to the atmosphere of methane, a powerful greenhouse gas, trapped in permafrost and in ocean sediments.
(1) Ice sheets and sea level Rapid changes affecting the marginal regions of the Greenland and Antarctic ice sheets may mean more melting and higher sea level than previously predicted. Bamber, et al., 2007 (2) Drought Climate models indicate that aridity in the southwestern U.S. will likely intensify and persist due to future greenhouse warming; if the model results are correct, this drying may have already begun. Photo Credit: Jupiter Images
(3) Atlantic meridional overturning circulation (AMOC) A collapse of the AMOC is very unlikely in the 21st century, however, a reduction in strength of 25-30% is very likely. Kuhlbrodt et al., 2007 (4) Methane An abrupt release of methane to the atmosphere this century is very unlikely. However, it is very likely that climate change will accelerate the pace of persistent emissions from hydrates and wetlands. Photo Credit: Molnia, USGS
Ecosystem Thresholds • “The point at which there is an abrupt change in a quality, property, or phenomenon or where small changes in a driver may produce large responses in the ecosystem”. (Groffman et al, 2006) 1933 2003 Grasslands to shrublands . . . . Source: Brandon Bestelmeyer
Key Drivers of Threshold-type Responses Alaskan Ecosystems • Thaw of permafrost • Insects and wildfire • Loss of sea ice Coastal Zones • Intense tropical storms • Sea level rise Coastal Retreat, Alaska N. Slope Coral Reefs Forests Coral Reefs • Drought • Fire • Pest and disease outbreaks • Summer SST increase (1°C) • Intense tropical storms
Sea Level Rise – Mid-Atlantic Region Blackwater National Wildlife Refuge, Chesapeake Bay, Maryland. Current land areas and potential inundation due to climate change
Ocean Coasts • It is virtually certain that erosion will dominate changes in shoreline position along the mid-Atlantic ocean coasts in response to sea-level rise and storms • For higher sea-level rise scenarios, it is very likely that some portions of the mid-Atlantic coast will undergo large changes which will depend in part on local geologic and oceanographic conditions • Specifically, some barrier island coasts will likely cross a threshold and become prone to more rapid landward migration or segmentation
Impacts on Gulf Coast Transportation Transportation Analysis Team • Rail • Airports • Pipelines Federal Advisory Panel • Highways and transit • Long range transportation planning • Emergency Management • Ports and waterways
Impacts on Gulf Coast Transportation Key Drivers: Temperature, Precipitation, Runoff, Storms, Sea Level Rise Relative sea level rise of 2 feet could permanently flood: • 19% of interstate miles, 20% of arterial miles • 64% of freight / 68% of non-freight facilities at ports Relative sea level rise of 4 feet could permanently flood: • 24% of interstate miles, 28% of arterial miles • 72% of freight facilities at ports • 9% of the rail miles operated, 20% of the freight facilities • 3 airports
Unified Synthesis Product Draft Expected release April 2009