Oslo
0. 0. 1. 1. Depth <m>. Delta -. Depth <m>. 2. 2. topsets. 5. 5. 10. 10. 0. 0. c11. c16. 3. 3. West-East <m>. sp4. Dip 2. Ground-. water-. table. Oslo. 5 m. Figure 4. Ground Penetrating Radar. p47. Flow model. Top 1. lp4. p45. Top 2. Dip 1. Figure 5.

Oslo
E N D
Presentation Transcript
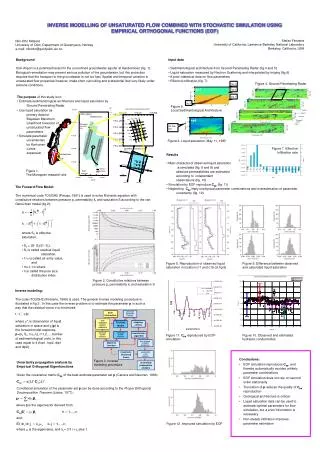
0 0 1 1 Depth <m> Delta - Depth <m> 2 2 topsets 5 5 10 10 0 0 c11 c16 3 3 West-East <m> sp4 Dip 2 Ground- water- table Oslo 5 m Figure 4. Ground Penetrating Radar p47 Flow model Top 1 lp4 p45 Top 2 Dip 1 Figure 5. Local Sedimentological Architecture p43 Ground Penetrating Radar profiles utm-N Oslo airport Gardermoen foresets p41 6678500 2D flow test Moreppen research site 6676500 Figure 6. Liquid saturation, May 11, 1995 Norway 6674500 GPR(47) Figure 7. Effective Infiltration rate N10 N10 Gardermoen N18 N18 Oslo N30 N30 N36 N36 6672500 N42 N42 N32 N32 N38 N38 GPR(45) N44 N44 N12 N12 N34 N34 N40 N40 railway N46 N46 Figure 1. The Moreppen research site N20 N20 runways 500m 614 000 616 000 618 000 utm-E GPR(44) GPR(46) Figure 8. Reproduction of observed liquid saturation in location c11 and c16 (cf.fig 6) Figure 9. Difference between observed and calculated liquid saturation corrected parameter estimate prior information true unknown system response stopping criteria TOUGH2 model calculated system response measured system response minimization algorithm Figure 11. Cpp reproduced by EOF-simulation Figure 10. Observed and estimated hydraulic conductivities best estimate of model parameters objective function maximum- likelihood theory a posteriori error analysis Figure 3. Inverse modeling procedure Uncertainty propagation analysis by Empirical Orthogonal Eigenfunctions Given the covariance matrix Cppof the best-estimate parameter set p (Carrera and Neuman, 1986): uncertainty propagation analysis Conditional simulation of the parameter set pcan be done according to the Proper Orthogonal Decomposition Theorem (Loève, 1977): wherebis the eigenvector derived from: and: Figure 12. Improved simulation by EOF wherem is the eigenvalue, and dij= 0 if i¹ j, else 1. INVERSE MODELLING OF UNSATURATED FLOW COMBINED WITH STOCHASTIC SIMULATION USING EMPIRICAL ORTHOGONAL FUNCTIONS (EOF) Stefan Finsterle University of California, Lawrence Berkeley National Laboratory Berkeley, California, USA Nils-Otto Kitterød University of Oslo, Department of Geophysics, Norway e-mail: nilsotto@geofysikk.uio.no Background Oslo Airport is a potential hazard to the unconfined groundwater aquifer at Gardermoen (fig. 1). Biological remediation may prevent serious pollution of the groundwater, but this protection requires that the transport to the groundwater is not too fast. Spatial and temporal variation in unsaturated flow properties however, make short cuircuiting and preferential flow very likely under extreme conditions. • Input data • Sedimentological architecture from Ground Penetrating Radar (fig.4 and 5) • Liquid saturation measured by Neutron Scattering and interpolated by kriging (fig.6) • A priori statistical data on flow parameters • Effective infiltration (fig. 7) • The purpose of this study is to: • Estimate sedimentological architecture and liquid saturation by Ground Penetrating Radar. • Use liquid saturation as primary data for Bayesian Maximum Likelihood Inversion of unsaturated flow parameters. • Simulate parameter uncertainties • by Karhunen- • Loève • expansion. • Results • Main character of observed liquid saturation • is simulated (fig. 8 and 9) and • absolute permeabilities are estimated • according to independent • observations (fig. 10) • Simulation by EOF reproduce Cpp (fig. 11) • Neglecting Cppimply unphysical parameter combinations and overestimation of parameter uncertainty (fig. 12) The Forward Flow Model: The numerical code TOUGH2 (Preuss, 1991) is used to solve Richards equation with constitutive relations between pressure p, permeability kr and saturation S according to the van Genuchten model (fig.2): • where Se is effective saturation, • Se = (S- Sr)/(1- Sr), • Sr is called residual liquid saturation, • 1/a is called air entry value, and • m=1-1/n where • n is called the pore size distribution index. Figure 2. Constitutive relations between pressure p, permeability kr and saturation S Inverse modeling: The code iTOUGH2 (Finsterle, 1999) is used. The general inverse modeling procedure is illustrated in fig.3 . In this case the inverse problem is to estimate the parameter p in such a way that the residual vector r is minimized: where y*j is observation of liquid saturation in space and yi(p) is the forward model response, p={ki, Sri 1/ai,ni}, i=1,2,…,number of sedimentological units, in this case equal to 4 (top1, top2, dip1 and dip2) Conclusions: • EOF simulation reproduces Cpp, and thereby automatically avoides unlikely parameter combinations • EOF simulation does not rely on second order stationarity • Truncation of preduces the quality of Cpp reproduction • Geological architecture is critical • Liquid saturation data can be used to estimate optimal parameters for flow simulation, but a priori information is necessary • Non-steady infiltration improves parameter estimation