Malnutrition
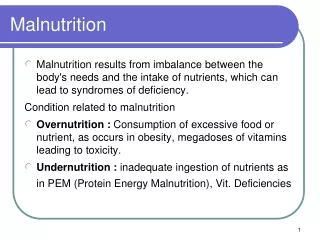
Malnutrition. MICS3 Data Analysis and Report Writing. Overview. Background International goals Indicators Indicator calculations Methodological issues Data. Background. Malnutrition is associated with more than half of all child deaths worldwide.

Malnutrition
E N D
Presentation Transcript
Malnutrition MICS3 Data Analysis and Report Writing
Overview • Background • International goals • Indicators • Indicator calculations • Methodological issues • Data
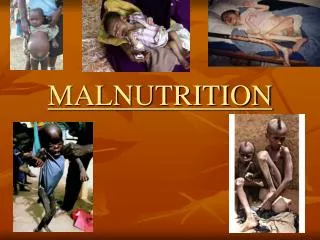
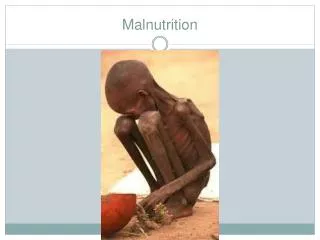
Background Malnutrition is associated with more than half of all child deaths worldwide. Undernourished children are more likely to die from common childhood ailments, and for those who survive, have recurring sicknesses and faltering growth. Three-quarters of the children who die from causes related to malnutrition were only mildly or moderately undernourished – showing no outward sign of their vulnerability.
International Goals & Targets Halve, between 1990 and 2015, the proportion of people who suffer from hunger Reduction of child malnutrition among children under five years of age by at least one-third, with special attention to children under 2 years of age
List of Indicators • Underweight prevalence (weight-for-age) • Stunting prevalence (height-for-age) • Wasting prevalence (weight-for-height) • Overweight prevalence (weight-for-height)
Definition of Indicators Underweight Prevalence Numerator: Number of children under age five that fall below minus two standard deviations from the median weight for age of the NCHS/WHO standard (moderate and severe); number that fall below minus three standard deviations (severe) Denominator: Total number of children under age five that were weighed % of children under five that fall below minus 2 standard deviations from the median weight for age of the standard NCHS reference population (moderate & severe)
Definition of Indicators Stunting Prevalence Numerator: Number of children under age five that fall below minus two standard deviations from the median height for age of the NCHS/WHO standard (moderate and severe); number that fall below minus three standard deviations (severe) Denominator: Total number of children under age five measured % of children under five that fall below minus 2 standard deviations from the median height for age of the standard NCHS reference population (moderate & severe)
Definition of Indicators Wasting Prevalence Numerator: Number of children under age five that fall below minus two standard deviations from the median weight for height of the NCHS/WHO standard (moderate and severe); number that fall below minus three standard deviations (severe) Denominator: Total number of children under age five that were weighed and measured % of children under five that fall below minus 2 standard deviations from the median weight for height of the standard NCHS reference population (moderate & severe)
Methodological Issues Measures of nutritional status • Underweight (weight for age): reflects a child’s total body mass. It is a composite measure of stunting and wasting. It is useful for describing the overall level of malnutrition and for assessing changes over time
Methodological Issues Measures of nutritional status • Stunting (height for age):reflects a child’s stature in relation to his age. It is an indicator of cumulative deficient growth associated with chronic insufficient dietary intake, frequent infection, and poor feeding practices over a long period. • Wasting (weight for height): indicates thinness or fatness. It is usually the result of recent nutritional deficiency. Affected by seasonal shifts associated with food availability and/or disease prevalence.
Methodological Issues Data used to assess nutritional status • Height (in centimeters) • measured lying down for children under 2 years old • measured standing up for children 2 or more years old • Weight (in kilograms) • Age (in decimal (2) months) • Sex • Note that if height and weight data are missing for more than 10% of children under-five, caution should be exercised in the interpretation of the results.
Methodological Issues International standard reference population • Undernourishment is gauged by comparing children to a reference standard. • The NCHS/WHO reference standard represents the distribution of height and weight by age and sex in a well nourished population. • WHO has developed a new reference population which will be released soon.
Methodological Issues International standard reference population • The distribution has been normalized so that the mean and median are equal. • Z-scores measure the number of standard deviation units that a child’s measurement deviates from the reference population median for that age.
Methodological Issues International standard reference population • In the reference population (i.e. in a well nourished population), 2.3 percent of children fall below minus 2 standard deviations and 0.1 percent fall below minus 3 standard deviations. • Height for Age and Weight for Age depend on accurate age reporting. In MICS, only children whose mothers reported both their month and year of birth are included in the calculations. • Children with out of range (i.e. highly improbable) z-scores are excluded.
Methodological Issues Measurement issues • Poor height and weight measurements • Measurement instruments • Training of interviewers • Response rates • Accuracy in age estimation • Age group reference: 0-36 months vs. 0-59 months • Unexpected pattern
Table NU.1: Child malnourishment Tabulation Plan