Ecological Pyramids
Ecological Pyramids. Pyramids of numbers, biomass and productivity. STARTER: Plot these values on a bar graph. Colour the bars using the key below Producer – Green Primary consumer – Yellow Secondary consumer – Blue Tertiary consumer - Red. Ecological Pyramids.

Ecological Pyramids
E N D
Presentation Transcript
Ecological Pyramids Pyramids of numbers, biomass and productivity
STARTER: Plot these values on a bar graph Colour the bars using the key below Producer– Green Primaryconsumer– Yellow Secondary consumer – Blue Tertiary consumer - Red
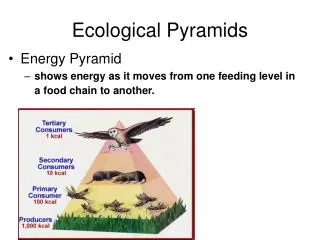
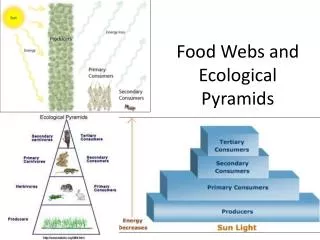
Ecological Pyramids • These are graphical models of the quantitative differences between the amounts of living material stored at each trophic level of a food chain. • They allow us to easily examine energy transfers and losses • There are three types which measure: • Number • Biomass • Productivity (Energy)
Pyramid of Numbers • A pyramid of numbers shows the number of organisms at each trophic level of the food chain
Now… • Cut out each of the bars and place them onto a separate piece of paper… • Which bar will go at the bottom? • Which bar will go at the top? • Stick them down…
Label! • Label each side of the pyramid with the following terms:
Pyramid of numbers • The length of each bar gives a measure of the relative numbers • Pyramids have producers at the bottom, usually in the greatest number
Pyramid of numbers • But some may have a large single plant, a tree, as the producer so the base is one individual
If we start to think about how many of each organism there are, we can start to build a pyramid of numbers...
Is it really fair that 1 lettuce counts for the same size box as 1 flea?
Is it really fair that 1 lettuce counts for the same size box as 1 flea?
STARTER: Is it really fair that 1 lettuce counts for the same size box as 1 flea in a pyramid of number? Explain your reasoning? A better way is to look at the quantity of living material (biomass) at each feeding (trophic) level...
Pyramids of biomass are always “pyramid-shaped” as at each stage of a food chain energy (biomass) is lost through respiration and body waste. fleas hedgehogs snails lettuces
Pyramids of biomass • A pyramid of biomass contains the biomass (mass of each individual x number of individuals) at each trophic level. • The units of a pyramid of biomass are units of mass per unit area, often grams per square metre (g m -2) or volume of water (g m -3) or sometimes as energy content (joules, J) • A pyramid of biomass is more likely to be a pyramid shape
STARTER Why are biomass and numbers SMALL at HIGHER trophiclevels?
Pyramids of productivity show • That the amount of available energy decreases down the food chain • It takes a large number of producers to support a small number of primary consumers • It takes a large number of primary consumers to support a small number of secondary consumers
PYRAMIDS OF PRODUCTIVITY show theflow of energybetweentropiclevels
GroupActivity • Make a poster withtheinformationgiven in thehandout Thingstoinclude: • Unitsforthedifferentpyramids • Explanationsfortheshape of eachpyramid of number • Explanationforwhy a pyramid of biomassisalways ‘pyramidshaped’ • Description of how a pyramid of energy shows energyflowthrough a foodchain