Download
1 / 28
280 likes | 409 Vues
This presentation, led by Sarah Goan and Tim Diomede, focuses on integrating Community Profiles into the Strategic Prevention Framework (SPF) to enhance data-driven decision-making in substance abuse prevention. Key objectives include reviewing the role of community profiles, providing guidance on their use, and introducing supplemental SEOW reference tools. Attendees will learn how to identify substance abuse patterns and trends, address information gaps, and effectively allocate prevention resources while monitoring progress towards health outcomes.

E N D
Hornby Zeller Associates, Inc. Utilizing CESN Data with the Strategic Prevention Framework Presented by Sarah Goan and Tim Diomede August 2012
Goals of Presentation • Review how Community Profiles fit into SPF • Provide guidance for using Community Profiles • Introduce new supplemental SEOW reference tools
Dual Purposes of SEOW/CESN Purpose of the State Epidemiological Outcomes Workgroup (SEOW) Purpose of the Community Epidemiological Surveillance Network (CESN) Promote systematic, data-driven decision-making Guide effective and efficient use of prevention resources Identify substance abuse patterns Establish and track substance abuse trends Detect emerging substances
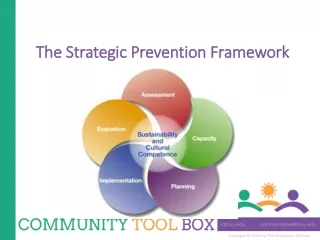
Role of Data in the Strategic Prevention Framework • Pinpoint areas of critical concern • Identify information gaps • Start conversations with key players • Make your case to access resources • Allocate scarce resources strategically • Implement programs that will affect change • Monitor indicators for progress and emerging concerns
Characteristics of the Community Profiles Reports for eight Maine Public Health Districts (PHDs) • Consumption • Consequences • Contributing Factors • Mental Health • Treatment
Community Profile Description Justification Summary 2012 Community Profiles http://www.maine.gov/dhhs/osa/data/profiles.htm
Understanding Community Needs • Does the consumption of one substance appear to be more of a problem than others? • Does one consequence appear to be more of a problem than others? • Is there a pattern of consumption or misuse among certain grades, age groups, or over time that is of particular concern? • How does your community compare with the state or other communities?
Example(s) from ProfilesComparing Prevalence Rates and Prioritizing
Informing Strategy/Program Selection • What are the common themes across the data sources? • What substances emerge as a high priority? • What do the profiles tell you about the factors that contribute to those patterns?
Identify Knowledge Gaps • Who is involved in the problem (age, gender, income, race/ethnicity)? • Where does the problem occur? • When does the problem occur? • Why is the problem occurring? Guide to Assessment, Planning and Evaluation 2011 http://www.maine.gov/dhhs/osa/pubs/data/2011/GuidetoAssess.Plan.Eval.pdf
Example: Finding a Gap • Who = Youth and young adults (18 to 25 year olds). I don’t know about gender. • Where = I don’t know • When = I don’t know • Why = Perceptions about risk of harm are low
Evaluating Your Work • Develop a Logic Model with measurable risk factors and longer-range outcomes • Monitor longer-term outcomes over time • Establish baselines and targets and see if they were met (Note: Can’t attribute change to specific work, but helps make the case)
Example: Baselines and Targets • List of the information and data available to you that “fit” your strategy/intervention • Consider those measures along with words like increased, decreased, more or enhanced • Determine what percent change is feasible • Percent change equation: Subtract current rate from a target rate and divide by current rate Step 1: 42 (target) - 45 (current) = 3 percentage points Step 2: -3 / 45 = -7% Step 3: Target = 7% decrease
Writing and Applying for Grants • Draft a “Statement of Need” • Focus on goals and objectives that are data-driven and measurable • Demonstrate capacity to monitor/report specific data indicators • Summarize sub-state data sources and/or trends using a state-produced source With the exception of MIYHS, PHD is the lowest level you can go and still have reliable estimates.
Break for Questions • How do you interpret the data correctly? • What information should I share with my Public Health District? • Not all schools in my county participate in MIYHS -- how valid is the data for us? Other Questions?
Community Data Overview Presentation4. Comparing Communities
Introduction of Quick Reference Guide • Includes indicators for: Consumption ● Consequences ● Contributing Factors • Targets areas of concern/high priority • Underage drinking among 12-20 year olds • Prescription drug misuse among 12-25 year olds • Marijuana use among 12-25 year olds • Two year snapshot of data Quick reference guide can be found by copying and pasting the following link http://www.maine.gov/dhhs/osa/data/cesn/indicatortableBW.docx
Reminder • The tools have snapshot comparisons across districts • The profiles have the detailed definitions/ language for each indicator as well as graphics • These three tools compliment each other and should be used all together Best Approach: use along with Guide to Assessment, Planning and Evaluation!
Resources Maine CESN Webpage (Maine OSA site > Data > Community Epi Surveillance Network) http://www.maine.gov/dhhs/osa/data/cesn/index.htm 2012 Community Profiles http://www.maine.gov/dhhs/osa/data/profiles.htm “Community Profile Data Overview” (presentation only) http://www.maine.gov/dhhs/osa/prevention/provider/powerpoints/ppt/CommunityDataOverviewwAndnotes.pdf “Community Data Overview” (recorded webinar ) http://www.maine.gov/dhhs/osa/prevention/provider/powerpoints/audio/1hrcallCommunityDataOverview2012.wmv CESN Quick Reference Tool http://www.maine.gov/dhhs/osa/data/cesn/QuickReferenceGuideColor.pdf Guide to Assessment, Planning and Evaluation 2011 http://www.maine.gov/dhhs/osa/pubs/data/2011/GuidetoAssess.Plan.Eval.pdf MIYHS 2011 Public Health District Summary Reports http://www.maine.gov/dhhs/osa/data/miyhs/2011SummaryPHD.html
Questions/Comments? Timothy Diomede SEOW Coordinator/Data Analyst Office of Substance Abuse/Hornby Zeller Associates Timothy.Diomede@maine.gov Sara Goan Manager/Data Analyst Hornby Zeller Associates sgoan@hornbyzeller.com