Download
1 / 45
460 likes | 605 Vues
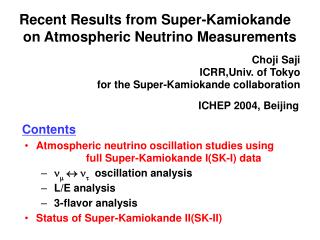
Latest Neutrino Oscillation Results From Super-Kamiokande. XXV Physics in Collision Prague 6-9 July 2005. Hank Sobel University of California, Irvine. 1996 1997 1998 1999 2000 2001 2002 2003 2004 2005 2006 2007. accident. SK-1. SK-2.

E N D
Latest Neutrino Oscillation Results FromSuper-Kamiokande XXV Physics in Collision Prague 6-9 July 2005 Hank Sobel University of California, Irvine
1996 1997 1998 1999 2000 2001 2002 2003 2004 2005 2006 2007 accident SK-1 SK-2 reconstruction and water filling SK-3 The Super-Kamiokande Detector • 50,000 ton • 1000 m underground (22,500 ton fid.) • 11,146 20 inch PMTs • 1,885 anti-counter PMTs 42m PMT coverage 40% 19% 40% 6 pe/MeV ; 1489 live-days 2.8 pe/MeV ; 622 live-days
OUTLINE • Atmospheric Neutrino Results • Two-flavor Analyses • SK-I Combined Analysis • L/E Analysis • New Combined Finer-Binned Analysis • SK-II results • Tau Analysis • Three-flavor Analysis- dominant mass scale • Solar Neutrino Results • Solar flux SK-I, SK-II • Time variation SK-I, SK-II • Spectrum SK-I, SK-II • 2-Flavor analysis SK-I • Latest K2K results
MNS Maki-Nakagawa-Sakata mixing matrix Mass Eigenstates Flavor Eigenstates 3 independent parameters + 1 complex phase q12, q23, q13, d Three Neutrino Picture Experimentalist version: Chooz Atmospheric n Solar n Long baseline Long baseline Reactor Future reactor
Small ne allowed Solar ~8x10⁻⁵ev2 Atmospheric ~2.5x10⁻³eV2 Atmospheric ~2.5x10⁻³eV2 Solar ~8x10⁻⁵ev2 Normal Inverted Mass Hierarchy?
About 15 km Atmospheric Neutrinos Study Angular Distributions of nm and ne withSuper-Kamiokande Pnn’ = sin22qsin2(1.27Dm2L/En) L ~ En / dm2 About 13,000 km Neutrinos produced in the atmosphere at ~15 km altitude... travel through the earth and interact in the detector.
Sensitivity of angular distribution to neutrino oscillations No oscillations Vary dm2 L ~ En / dm2 10-2 dm2 = 10-4 10-3 Sensitivity from ~10-4 to 10-1 eV2 10-1 Down-going Up-going
Particle Identification sub-GeV Electron-like: e, g, p0 multi-GeV MC, CC events 0.8 +/- 0.1% Cosmic-ray m: 0.4 +/- 0.1% Michel e’s: 1.8 +/- 0.5% Mis-ID Prob.: Muon-like: m, p+/- Based on likelihood of shape around Cerenkov ring.
Atmospheric Neutrino Interactions p • Contained (ne , nm ) • Fully-Contained (FC) • En ~ 1 GeV • Start inside, stop inside • Partially-Contained (PC) • En ~ 5 GeV • Start inside, stop outside • Upward-going muons • Stopping • En ~ 5 GeV • Start outside, stop inside • Through-going • En ~ 200 GeV • Start outside, stop outside p, k m, n
SK I Combined 2-Flavor Analysis Zenith angle distributions 1489 live-days, 100 yr MC, >15,000 neutrino events upgoing downgoing
fractional change in event rate due to systematic systematic parameters (39 based on flux, x-scn, selection, reconstruction) observed events in bin oscillated expectation estimated uncertainty in ej MC statistical and systematic uncertainties Oscillation Analysis 'Pull method', Fogli et al, hep-ph/0206162 Total 180 bins in zenith angle, momentum
Allowed Oscillation Parameters SK I standard combined analysis BEST FIT: m2 = 2.1 10-3 eV2 sin2(2Θ) = 1.0 BEST FIT(UNPHYSICAL): m2 = 2.1 10-3 eV2 sin2(2Θ) = 1.02 1.5x10⁻³eV2<Dm2< 3.4x10⁻³ eV2 sin22q > 0.92 (@90%C.L.)
L/E Oscillation Analysis FC/PC events Expected oscillation pattern Poor resolution in L/E (~10's of %) Smears out oscillation pattern
Select Events for Good L/E Resolution (<70%) FC single ring m-like FC multi ring m-like Horizontal Horizontal Low Energy Low Energy PC OD through-going PC OD stopping Horizontal Horizontal Low Energy Low Energy L is not well measured near horizon and at low energy
Result of Event Selection Data MC Oscillation dip decoherence decay Selected subset (2700 events ~1/5 of total data) 100 Year MC After event selection Neutrino Decay: Δ2=11.3 = 3.4 Decoherence: Δ2=14.5 = 3.8
Best Fit Using High-resolution L/E Sample Overlay with zenith angle results Best Fit Results: Dm2 = 2.4 x 10⁻³ eV2 sin2(2q) = 1.0 (constrained to physical region) c2min= 37.9/40 DOF Somewhat better Dm2 resolution 1.9x10⁻³ < Dm2< 3.0x10⁻³ eV2 0.90 < sin22q (@90%C.L.)
Preliminary test New Finer-Binned 2-Flavor Analysis Try to combine advantages of: • Zenith angle analysis (good sensitivity for sin22q) • L/E analysis (good sensitivity for dm2) • PC events divided into OD stop and OD through-going • New FC multi-ring e-like category • Finermulti-GeVmomentum binning – sensitive to region of oscillation dip • Total of 370 bins in 10 zenith angle, 37 momentumbins • c2 incorporates Poissonian uncertainties
Zenith angle distributions Preliminary
Allowed region with finer-binned analysis Best Fit Results: (constrained to physical region) Dm2 = 2.5 x 10⁻³ eV2 sin2(2q) = 1.0 c2min= 375.2/367 DOF Preliminary SK-I 370 bin analysis Comparison with 180 bin analysis 2.0 < Dm2 < 3.0 x 10⁻³ eV2 sin22q > 0.93 (@90%C.L.)
Super-K II results 1.72 live-years FC/PC ; 1.67 live-years upmu ; 60 yr SK II MC Preliminary
Super-K II Oscillation Analysis Preliminary L/E Analysis Best Fit Results: Dm2 = 2.6 x 10⁻³ eV2 sin2(2q) = 1.0 (constrained to physical region) c2min= 54.8/40 DOF Best Fit Results: Dm2 = 3.1 x 10⁻³ eV2 sin2(2q) = 0.98 (constrained to physical region) c2min= 394.5/367 DOF 370 bin combined zenith angle analysis
Search for Appearance 100 • Very difficult in water detector • With Dm2~(few)10-3 eV2 • Expect ~1 event/kt-yr from atmospheric neutrinos • All CC events upward-going • Deep-inelastic channel dominates 10-1 10-2 CC rate/kt-yr vs. m2 10-2 10-4 10-3 Dm2 (eV2) ~1 event/kt-yr i.e. about 90 nt in our data now. S/N ~0.7%
Appearance Signature Hadrons Electron or muon or hadrons • Simulate cross-sections, topologies • Characteristics: • Mean neutrino energy ~10 GeV • > 80% are showering • Combination of electron and hadron showers • Lots of pions • Find -like particle ID estimator • Look for excess in upward direction nt nm t nt t production threshold = 3.5 GeV
Two Tau Analyses Not statistically independent • Concentrate on hadronic decays of Tau • Event shape • Extra pion production • Pick FC events in fiducial volume > 2m from wall • Pick variables which distinguish Tau’s from atmospheric background and compare with downward-going data • Make likelihood or neural network to select tau-like events relative to atmospheric BG
Down-going data Down-going νμ, νe MC MC Input Variable Distributions Max. distance between primary and electron vertex from mu→e Visible energy Max. momentum for mu-like ring Log of sphericity in the lab frame by energy flow analysis Clustered sphericity by the energy flow analysis Number of ring candidates
Signal Efficiency of Cuts Efficiency after Fiducial, Evis,PID and NN cut 36% Tau Eff Efficiency after Fiducial, Evis,PID and Likelihood cut 42% Tau Eff Tau BG 69% Signal Output of Neural Net t-likelihood
Likelihood (42% efficiency) Neural Network (36%efficiency) Tau Signal MC expectation: 7931t's(error dominated by flux and cross-section) Two analyses (likelihood and neural network) yield consistent answers t Signal= 152 47stat 12.027.3 = 145 48stat 9.436.2 Parameters varied: Δm2: 2.0-2.7x10⁻³ ev2 ; sin22q: .93-1.0 ; q13 moved to CHOOZ limit; Systematic error dominated by q13 error.
If Dmatm2 >> Dmsolar2 & d=0 m2 { m3 Dm2 ~ Dm132 ~ Dm232 ; q23 ; q13 m1 atmospheric m2 } solar m3 m1 Normal Inverted 3 Flavor Neutrino Oscillation Analysis Oscillation can be described by 3 parameters Consider matter effects: Look for signature of non-zero q13 in enhancement of ne for certain angles and energies Look for differences between neutrinos and antineutrinos.
Single-ring electrons (2.5<P<5.0GeV) P(nene) P(nenm) P(nmnm) P(nmne) Positive m2 Negative m2 Null oscillation GeV Try to Observe Matter Effect 1. Look for enhancement of high-energy ne Take Dm2 = 3x10⁻³ ; sin2q23 = 0.5 ; sin2q13 = 0.026 P ( nmne) Look at Cosq=0.6 Cos q En (GeV) 20 yr SK MC No significant excess due to matter effect was seen in upward-going multi-GeV single ring electron sample
Multi-ring e-like Single-ring e-like 2. Look for Differences Between Neutrinos and Antineutrinos • For inverted hierarchy, the resonance happens for antineutrinos, not neutrinos. • There are n vs n differences in s and ds/dy, and the relative fraction of n vs nis different for different subsamples. NC + others NC + others CC e CC e CC e CC e higher ne/ne ratio
Single-ring e-like (2.5<P<5.0GeV) Multi-ring e-like(2.5<P<5.0GeV) m2= 0.002 eV2 sin223 = 0.5 sin213 = 0.05 Positive m2 Negative m2 Null oscillation For example: more enhancement of upward-going multi-GeV e-like vs single rings for normal hierarchy SK 20 years higher ne/ne ratio cosq
Data: Multi-GeV e-like events single-ring multi-ring cosq no excess seen... - use fine-binned analysis, Poisson-style uncertainties - treat inverted and normal hierarchy cases separately
3 Flavor Analysis(assume Δm122=0) Normal hierarchy Inverted hierarchy Preliminary Preliminary Best Fit: c2min= 376.76/368 DOF Dm2=2.5 x 10⁻³ eV2 sin2q23 = 0.525 sin2q13 = 0.00625 Best Fit: c2min= 376.82/368 DOF Dm2=2.5 x 10⁻³ eV2 sin2q23 = 0.5 sin2q13 = 0.0
Solar Neutrinos e-type neutrino other active flavors Recoil electron spectrum with detector resolution
Solar Neutrino Flux in SK-1 May 31, 1996 – July 13, 2001 Best fit e Background q Data n ● f(8B)day = 2.32 0.03 0.08 0.07 22385 solar n events (14.5 events/day) f(8B)night = 2.37 0.03 0.08 8B flux : 2.35 0.02 0.08[x 106 /cm2/sec] D-N = -(0.021 0.020 ) 0.013 0.012 (D+N)/2
Signal 5482 +132-130 (stat.) 7.0 – 20.0 MeV 622 days SK-II Preliminary Solar Neutrino Flux in SK-2 SK-2 622day 7.0 – 20 MeV 22.5kt Dec. 24, 2002 – May 19, 2005 Best fit Background Data ● 5482 solar n events (8.8 events/day) f(8B)day = 2.39 0.09 0.08 8B flux : f(8B)night = 2.35 0.08 2.36 0.06[x 106 /cm2/sec] D-N = (0.014 0.049) (D+N)/2
Spectrum SK-1 SK-2
SK Excluded and Allowed Regions SK Zenith Spectrum & Rate SK Zenith Spectrum
Changes to Global Analysis I. Full SNO Salt Data II. Full KamLAND Likelihood KamLAND Collaboration, hep-ex/0406035 v3 SNO Collaboration, nucl-ex/0502021
Oscillation Parameters from Solar Neutrino and KamLAND Experiments Best fit: tan2q=0.437 +0.4 +0.08 -0.3 dm2=7.94 x10⁻⁵eV2 -0.05 Solar & KamLAND Solar+KamLAND KamLAND 99.73% 95% Solar Michael Smy, UC Irvine
Schematic Overviewof K2K Experiment started in April, 1999 Terminated in November, 2004 GPS Satellite (broadcasts time) Proton Synchrotron 12 GeV Protons Neutrinos Pions Decay Pipe Magnetic Horns Tracker 1kton
K2K-I + K2K-II Results Single-ring m-like events Best Fit Results: Dm2 = 2.8 x 10⁻³ eV2 sin2(2q) = 1.0 (constrained to physical region) No-oscillation excluded at >4s
K2K 90%CL upper limit CHOOZ 90%CL upper limit Feldman-Cousins Conventional method (single sided) Limit on qme Expected BG: 1.63 Observed: 1 1.25 nminteractions + 0.38 beam ne
Conclusions 1.5x10⁻³eV2<Dm2< 3.4x10⁻³ eV2 sin22q > 0.92 (@90%C.L.) • Several SK oscillation results point to oscillations near dm2 = 2.4x10⁻³ eV2 • Full analysis • L over E • New fine-binned analysis • SK-II atmospheric and solar data is consistent with SK-I • Tau appearance now at 3s level – consistent with expectations • Improved 3-flavor analysis limit on q13 • New K2K results consistent • Rules out no oscillation at >4s 1.9x10⁻³ < Dm2< 3.0x10⁻³ eV2 sin22q > 0.90 (@90%C.L.) 2.0 < Dm2 < 3.0 x 10⁻³ eV2 sin22q > 0.93 (@90%C.L.) Dm2 = (2.55 0.40)x10-3eV2 sin22q = 1.19 0.23