Procurement Fraud
Procurement Fraud. November 11, 2008. Mike Blakley. Detection and Prevention. Session objectives. Current trends, techniques and best practices Understand statistical basis for analysis Procurement cards (p-cards) Understand use of Excel. Top Six Indicators That you might have a fraud.

Procurement Fraud
E N D
Presentation Transcript
ProcurementFraud November 11, 2008 Mike Blakley Detection and Prevention
Session objectives • Current trends, techniques and best practices • Understand statistical basis for analysis • Procurement cards (p-cards) • Understand use of Excel
Top Six IndicatorsThat you might have a fraud • 6. System designed to do “three way match”, but only does two way • 5. Procurement software system doesn’t do a match • 4. When auditors ask to help them out, they point to the door • 3. No procurement software system • 2. Procurement clerk drives a Porsche • 1. Clerk’s kids drive Porsches between mountain home and beach home
Overview • Fraud patterns detectable with digital analysis • Basis for digital analysis approach • Usage examples • Using Excel
The Why and How Objective 1 • Two brief examples • IIA Guidance Paper • Auditors “Top 10” • Process Overview • Who, What, Why, When & Where
Example 1School Bus Transportation Fraud Objective 1 • Supplier Kickback – School Bus parts • $5 million • Jail sentences • Period of years
Regression Analysis Objective 1 • Stepwise to find relationships • Forwards • Backwards • Intervals • Confidence • Prediction
Data outliers Objective 1 • Sometimes an “out and out Liar” • But how do you detect it?
Data Outliers Objective 1 • Plot transportation costs vs. number of buses • “Drill down” on costs • Preventive maintenance • Fuel • Inspection
Medicare HIV Infusion Costs Objective 1 • CMS Report for 2005 • South Florida - $2.2 Billion • Rest of the country combined - $.1 Billion
Pareto Chart Objective 1
Guidance Paper Objective 1 • A proposed implementation approach • “Managing the Business Risk of Fraud: A Practical Guide” http://tinyurl.com/3ldfza • Five Principles • Fraud Detection • Coordinated Investigation Approach
Objective 1 Managing the Business Risk of Fraud: A Practical Guide • IIA, AICPA and ACFE • Report issued 5/2008 • Section 5 – Fraud Detection
Section 5 – Fraud Detection Objective 1 • Detective Controls • Process Controls • Anonymous Reporting • Internal Auditing • Proactive Fraud Detection
Proactive Fraud Detection Objective 1 • Data Analysis to identify: • Anomalies • Trends • Risk indicators
Specific Examples Cited Objective 1 • Journal entries – suspicious transactions • Identification of relationships • Benford’s Law • Continuous monitoring
Objective 1 Data Analysis enhances ability to detect fraud • Identify hidden relationships • Identify suspicious transactions • Assess effectiveness of internal controls • Monitor fraud threats • Analyze millions of transactions
Peeling the Onion Objective 1c
Fraud Pattern Detection Objective 1d
Who Uses Analytics Objective 1e • Traditionally, IT specialists • With appropriate tools, audit generalists (CAATs) • Growing trend of business analytics • Essential component of continuous monitoring
Objective 1e Analytics – what is it? • Using software to: • Classify • Quantify • Compare • Both numeric and non-numeric data
Objective 1e How - Assessing fraud risk • Basis is quantification • Software can do the “leg work” • Statistical measures of difference • Chi square • Kolmogorov-Smirnov • D-statistic • Specific approaches
Objective 1e Why - Advantages • Automated process • Handle large data populations • Objective, quantifiable metrics • Can be part of continuous monitoring • Can produce useful business analytics • 100% testing is possible • Quantify risk • Repeatable process
Why - Disadvantages Objective 1e • Costly (time and software costs) • Learning curve • Requires specialized knowledge
Objective 1e When to Use Analytics • Traditional – intermittent (one off) • Trend is to use it as often as possible • Continuous monitoring • Scheduled processing
Objective 1e Where Is It Applicable? • Any organization with data in digital format, and especially if: • Volumes are large • Data structures are complex • Potential for fraud exists
Objective 1 Summarized Objective 1 • Two brief examples • IIA Guidance Paper • “Top 10” Metrics • Process Overview
Objective 1 - Summarized • Understand why and how • Understand statistical basis for quantifying differences • Identify ten general tools and techniques Next is the basis …
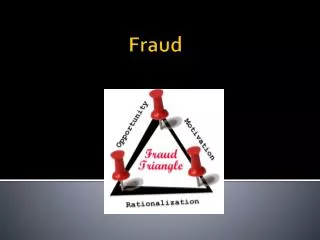
Objective 2 Basis for Pattern Detection • Analytical review • Isolate the “significant few” • Detection of errors • Quantified approach
Objective 3 Objective 2 Trapping anomalies
Objective 2 Understanding the Basis • Quantified Approach • Population vs. Groups • Measuring the Difference • Stat 101 – Counts, Totals, Chi Square and K-S • The metrics used
Objective 2a Quantified Approach • Based on measureable differences • Population vs. Group • “Shotgun” technique
Objective 2a Detection of Fraud Characteristics • Something is different than expected
Objective 2b Fraud patterns • Common theme – “something is different” • Groups • Group pattern is different than overall population
Objective 2c Measurement Basis • Transaction counts • Transaction amounts
Objective 2d How is digital analysis done? • Comparison of group with population as a whole • Can be based on either counts or amounts • Difference is measured • Groups can then be ranked using a selected measure • High difference = possible error/fraud
Objective 2d Histograms • Attributes tallied and categorized into “bins” • Counts or sums of amounts
Objective 2d Two histograms obtained • Population and group
Objective 2d Compute Cumulative Amount for each
Objective 2d Are the histograms different? • Two statistical measures of difference • Chi Squared (counts) • K-S (distribution) • Both yield a difference metric
Objective 2d Chi Squared • Classic test on data in a table • Answers the question – are the rows/columns different • Some limitations on when it can be applied
Objective 2d Chi Squared • Table of Counts • Degrees of Freedom • Chi Squared Value • P-statistic • Computationally intensive
Objective 2d Kolmogorov-Smirnov • Two Russian mathematicians • Comparison of distributions • Metric is the “d-statistic”
Objective 2d How is K-S test done? • Four step process • For each cluster element determine percentage • Then calculate cumulative percentage • Compare the differences in cumulative percentages • Identify the largest difference
Objective 2d - KS Kolmogorov-Smirnov
Objective 2e Classification by metrics • Stratification • Day of week • Happens on holiday • Round numbers • Variability • Benford’s Law • Trend lines • Relationships (market basket) • Gaps • Duplicates
Objective 3 Fraud Pattern Detection
What can be detected Objective 2 • Made up numbers – e.g. falsified inventory counts, tax return schedules
Benford’s Law using Excel Objective 2 • Basic formula is “=log(1+(1/N))” • Workbook with formulae available at http://tinyurl.com/4vmcfs • Obtain leading digits using “Left” function, e.g. left(Cell,1)