Understanding Simple Probability of Events and Outcomes
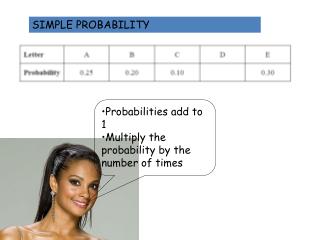
This guide introduces the concept of simple probability, which quantifies the likelihood of events occurring. It uses the formula P(Event) = Number of Favorable Outcomes / Total Number of Outcomes, illustrated through practical examples such as spinning a spinner or rolling dice. For instance, if a spinner has sectors totaling 360°, the probability can be calculated for specific angles. The resource emphasizes how probabilities improve with larger sample sizes and provides examples involving dice to demonstrate calculating probabilities based on favorable outcomes.

Understanding Simple Probability of Events and Outcomes
E N D
Presentation Transcript
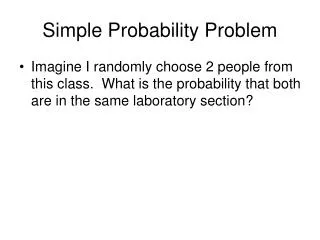
7.7 Simple Probability Obj: to complete the probability of simple events
Probability of an (event) = # of favorable (better) outcomes # of total outcomes P = Favorable (what we like) Total
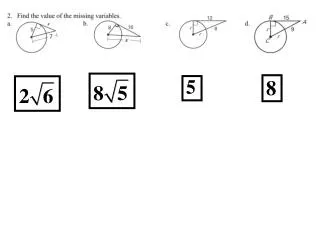
Ex. 1: P What is the probability of the spinner landing on the region <POR? R 0 Q P ( <POR = 45 1 = 8 360 360 is full circle One out of every 8 spins you will land on the region POR
Ex. 2: Given that < POQ is 180, what is P ( landing in < ROQ? P 180- 45=135 R 45º P( <ROQ = 135 = 3 0 360 8 Q
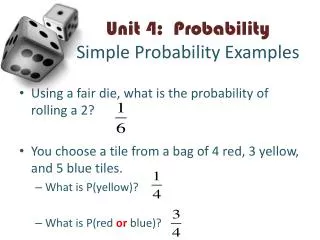
Ex. 3: Favorable Total # of white dice = 11 # of white dice = 8 # of white dice = 5 5 P (green) P (yellow) P (red) P (green or white) P (white) P (green or red) 0 0 24 24 8 1 16 2 = = 24 3 3 24 11 13 24 24 As you increase the sample size your experimental probability gets better.
Ex. 4: If you roll two dice what is the probability of a total greater than 8? Die # 2 Die # 1 1 2 3 4 5 6 P (total >8) = 10 5 1 2 3 4 5 6 • 3 4 5 6 7 • 4 5 6 7 8 • 5 6 7 8 9 • 6 7 8 9 10 • 7 8 9 10 11 • 7 8 9 10 11 12 36 18 10