A-F School Grades
A-F School Grades. July 25, 2012. Better Accountability for Schools. What’s New?. Key Changes in School Grading Calculation changes mandated by the federal government in New Mexico’s NCLB waiver. Bonus points.

A-F School Grades
E N D
Presentation Transcript
A-F School Grades July 25, 2012
What’s New? • Key Changes in School Grading • Calculation changes mandated by the federal government in New Mexico’s NCLB waiver. • Bonus points. • Inaugural Opportunity to Learn (OTL) survey completed by over 194,000 New Mexico students.
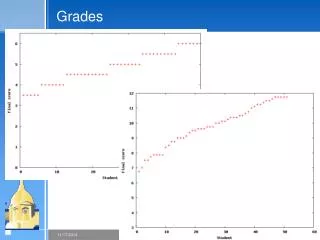
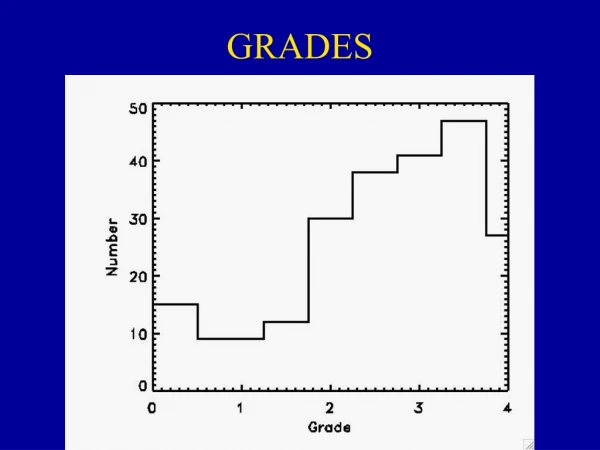
Validity of School Grade Results • Do school grades meaningfully distinguish among schools? Yes. • Grades made up of a composite of several components – the following charts demonstrate that grades do, in fact, differentiate schools well. • Schools consistently perform well or poorly across all the components of the grade.
Student Performance and School Grades • AYP forced focus on percent proficient and above. • School grades includes a component of percent proficient and above, but school grades also include growth. • Initial reaction to a grade is to look at percent proficient and above, but this is not the sole basis for a grade – percent proficient and above does not tell the whole story.
Decomposing Performance • Several components of school grades depend upon student SBA results. • It is important to consider underlying student performance for each year used in grades. • Correlation between Performance level and Scale Score = 0.91. • Correlation between Scale Score from year to year = 0.77. • How much does prior performance "explain" current year? 59.3% .
Decomposing Performance • Previous slide indicated that: • Performance levels and scale scores are not perfectly related; that is, they always don’t tell the exact same story. • Student performance changes from year to year. In fact, a student’s prior score explains about 59% of the variability in current scores. • This means student performance changes – and school grades are designed to pick up those changes.
Decomposing Performance The table on the right indicates that students change performance levels (PL) from year to year. In fact of those that change, half move up and half move down. Scale scores exhibit the same pattern, except because scale scores provide a more nuanced picture of performance there is more change.
Decomposing Performance The table below indicates that even among the students that stay at the same performance level, 89% them change scale scores – half up and half down. About 86% of schools stayed within one grade.
School Grade Examples • The following few slides provide to examples of how school grades work.
This school received a D and did fairly poorly in school growth and Q3 growth
In fact, even though percent proficient does not tell the whole story, for this school experienced a big drop in percent proficient and above
Estimating Student Growth • SS_Mtij = γ000 + γ010*Q1_MIN10ij + γ100*FAYtij + γ200*YEARtij+ γ210*YEARtij*Q1_MIN10ij + r0ij + r2ij *YEARtij+ u00j + u20j*YEARtij + u21j*YEARtij*Q1_MIN10ij + etij
Student Growth For each student his or her score for each year (FAY) and Q1 status are included. Scale scores are a function of Year and so the fact that a student is missing a year is not important for estimating growth for a school.
Student Growth • The following slide provides the overall student growth results for math.
Student Growth • The results indicate the mean math scale score for Q3 students is about 42 • The average Q3-Q1 gap is about 16.87. • The mean growth for Q3 non-FAY students is -0.787 scale score points per year • FAY students grow about 0.56 scale score points per year faster. • Q1 students grow about 1.73 scale score points per year more quickly than Q3 students.
Example 2: Changes in Percent Proficient don’t tell the whole story
The table on the right demonstrates the example school’s growth in math. The expectation in Q3 is for students to have a growth estimate of 0. The students in this school grew at -1.7, which placed them in earned them 4% of the available point for math Q3 growth – or 0.376 points. The school did slightly better in Q1 math growth and so earned 29% of school growth, or about 2.9 points for math Q1 growth.
School Growth applies a value added model (VAM) to a school’s growth over the past three years to generate points towards a school grade. High School demonstrates some improvement over the past three years.
Most of the school growth demonstrated by High School is accounted for by the growth of High School’s students while they were in eighth grade. The Value Added Model appropriately levels the playing field by taking prior student performance into account for which High School is not responsible.