Download
1 / 13
130 likes | 251 Vues
2012 A-F Letter Grades. Arizona Department of Education - Research & Evaluation Division. 2012 A-F Letter Grades. 1733 Schools Included. Percent Passing – All Schools *. Frequency of Schools. *K-2 School not included. Mean Growth – All Schools *. Frequency of Schools.

E N D
2012 A-F Letter Grades Arizona Department of Education - Research & Evaluation Division
2012 A-F Letter Grades 1733 Schools Included
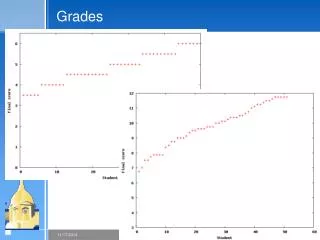
Percent Passing – All Schools* Frequency of Schools *K-2 School not included
Mean Growth – All Schools* Frequency of Schools *K-2 School not included Overall Growth Points
Traditional Schools Comparison – 2011 and 2012 24% 20% 36% 10% 36% 30% 12% 33%
Traditional Schools Comparison – 2011 and 2012 Total Points 2012
2012 A-F Letter Grades Alternative Schools
2012 A-F Letter Grades – All, Charter & Non-Charter Small Schools Traditional Alternative Schools ALL(N=1572) Charter (N=284) Non-Charter (N=1288) ALL(N=222) Charter (N=133) Non-Charter (N=89) ALL(N=163) Charter (N=101) Non-Charter (N=62)
2012 A-F Letter Grades - LEAs • All components of the A-F Letter Grade model (Traditional*) used for LEAs was calculated at the LEA level • 1% cap applies at the LEA level for students taking AIMS A *Please Note: LEAs with only one school - the LEA’s A-F Letter Grade is the same as their school LEAs with only Alternative schools - the LEA’s letter grade is an average of their schools’
Success Stories • A School went from a ‘D’ to an ‘A’ with a 32 point increase in growth and a 20 point increase in composite points • A Charter school increased 20 points in growth and had 7 point increase in composite points • A high school with 100% Native American population went from a ‘D’ in 2011 to a ‘B’ in 2012 with a 20 point increase in growth and a 4 point increase in composite points • 2 schools went from a ‘D’ to an ‘A’ • 11 schools went from a ‘D’ to a ‘B’ • 18 schools had an increase of 20+ growth points
Thank you Dr. Carrie L. GiovannoneDeputy Associate SuperintendentResearch & Evaluation achieve@azed.gov602-542-5151


![a letter [‘ letǝ ]](https://cdn2.slideserve.com/4045341/a-letter-let-dt.jpg)