E ducation A nd R esearch: T esting H ypotheses
340 likes | 503 Vues
E ducation A nd R esearch: T esting H ypotheses. 2003 Science Framework for California Public Schools.

E ducation A nd R esearch: T esting H ypotheses
E N D
Presentation Transcript
2003 Science Framework for California Public Schools “When large blocks of time for science instruction are not feasible, teachers must make use of smaller blocks. For example, an elementary teacher and the class may have a brief but spirited discussion on why plant seeds have different shapes or why the moon looks different each week.” Pages 5-6
Pew Ocean Commission Report June 4, 2003 “Broaden ocean education and awareness through a commitment to teach and learn about our oceans, at all levels of society”
US Commission on Ocean Policy • Recommendation 4–7. Congress, working with the National Ocean Council (NOC), should amend the National Oceanographic Partnership Act (NOPA) to integrate ocean observing, operations, facilities, and education into its marine research mission. A strengthened and enhanced National Ocean Research Leadership Council should be redesignated as the Committee on Ocean Science, Education, Technology, and Operations (COSETO). NOPA amendments should specify that COSETO reports to the NOC and is chaired by the director of the Office of Science and Technology Policy. [OCEAN.ED]
Monterey Accelerated Research System
North-East Pacific Time-series Undersea Networked Experiments
The Web Data Distribution Courtesy of J. Graybeal NEPTUNE MARS
Useful Definitions • Real-time: obeying a maximum response time to stimuli (How long a time? Well… ) • Near-real-time: usually obeying a preferred maximum response time to stimuli • Archival: stored for future access • Packaged: reprocessed for easy access • Metadata: information about other data • Event: a condition of scientific interest detected in the data stream • ** REAL-TIMELY: real data that is QC’ed and recent/relevant (who decides what, where, when?)
Conclusions • Good: Control data views. Better: Control the experiment. Best: Build and run the experiment. • “Don’t just learn science, do it” requires teamwork, creativity, and organized thinking • Doing science enables discoveries in many realms (science, engineering, computer science, operations) • But! Initial successes must be programmed, not left to chance—constructing this will take some time • Support discovery by analysis (can use archives) and by serendipity (near-real-time monitoring) • Don’t push “real-time” data: it’s too expensive and flaky (use near-real-time and archival data instead)
Department of Commerce – Feb. 2002 • Two million new Internet users per month. • In September 2001, 143 million Americans (about 54 percent of the population) were using the Internet — an increase of 26 million in 13 months. • Ninety percent of children between the ages of 5 and 17 (or 48 million) now use computers. • Seventy-five percent of 14-17 year olds and 65 percent of 10-13 year olds use the Internet. • Family households with children under the age of 18 are more likely to access the Internet (62 percent) than family households with no children (53 percent), and non-family households (35 percent). • Computers at schools substantially narrow the gap in computer usage rates for children from high and low income families. based on the September 2001 U.S. Census Bureau’s Current Population Survey - a survey of approximately 57,000 households and more than 137,000 individuals across the United States.
BRIDGE website • http://www.vims.edu/bridge/ • Using the www to bridge the gap between research and education. • There is just TOO much information out there, the need for a site that does the initial screening, annotating, quality control was obvious. • Since then, it’s expanded to include the conversion of raw/processed data into something useful for educators.
MBARI/BRIDGE Collaboration • Hold the Anchovies!Have commercial fisheries brought anchovy and sardine stocks to all-time lows? Or, are they simply at a natural low spot in a 50 year cycle? Learn more in our Data Tip, a collaboration with the Monterey Bay Aquarium Research Institute. Pumping iron can make a person stonger, more fit. But can pumping iron into the oceans improve the fitness of the Earth? Since the Industrial Revolution, humans have been contributing significantly to global warming partly through the release of large amounts of CO2, a greenhouse gas.
Integrated approach to science, art, and the humanities education: The challenge is to “convey the essence of our enthusiasm without the mind-numbing complexity intrinsic to real science.”
Education and Research: Testing Hypotheses (EARTH) • Workshop - March 7-8, 2002 • 25 participants from around the US • The primary objective of the workshop was be to find out what teachers would like/need in the classrooms with regard to real-time data.
Getting the Data to You • How to get the data • Pull—from web site, or using an application • Push—email, ftp files, or broadcast • How much data? • How much do you want? (too much is bad) • How much can you handle? (big or little pipe?) • Design system with your answers in mind • If you know what you’ll do with the data, you can decide how much you’ll need (maybe) • ‘Pull’ is more manual, but easier to implement
Workshop summary • WWW interface the most effective method of interaction • The material should NOT be setup by grades but rather by complexity (packaged data on one end and 'raw' data on the other). • The entire site should be planned with the potential of other types of data coming from different platforms (ships, ROVs, AUVs, observatories).
Education And Research: Testing Hypotheses • Exploring how to best use near-real-time data in the classroom. • Interest is in packaged data products that are already QC’d and archived. • Case-studies • Near-real-time data • Tools
EARTH Teacher Workshop http://www.mbari.org/education/earthwksp.htm Educate, excite, and engage teachers with the concept of observatory (surface, benthic, and pelagic) data in the classroom. Develop curricula enabling teachers and students to utilize near-real-time data.
Full-hemisphere views of the Earth from GOES (Geostationary Operational Environmental Satellites).GOES satellites are built by NASA and operated by NOAA.
With regards to specific aspects of the workshop, evaluation numbers were as follows • Scientific level of content: 95% just right • Pacing of activities: 82% just right • Enjoyment fun: 91% just right • Relevance to teaching: 81% very relevant • Interest level: 91% very interesting • Interactions with colleagues: 91% just right • Interactions with scientists: • 50% not enough; 50% just right
Pre vs post agreement with statements Comfort using the Internet with students pre: 70% post: 100% Comfort using real-time data with students pre: 65% post: 100% Confidence using real-time data with students pre: 78% post: 91% Availability of easy-to-use lessons on web pre: 61% post: 86%
94% of respondents said they agreed or strongly agreed that they had found new materials on the Internet that they could use with their students. 100% said they were leaving with materials they could use with their students.
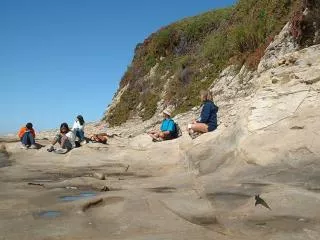
Top criticisms offered by respondents were: • not enough time to explore in depth the websites presented in the workshop • not enough interaction with MBARI scientists, either by getting involved with their research or seeing demonstrations of their research • not enough time given to develop lessons/projects • need to add time/opportunities to explore the local ocean environments (beaches, tidepool, canyon).
2004 EARTH Workshop • July 6-8, 2004 • Bringing back teachers from 2003 plus others that have used the materials • Discuss how well the activities/lessons worked in participants‘ classrooms • Fix/add to the current activities/lessons • Possibly develop additional activities/lessons.