Load Driven Distribution Systems
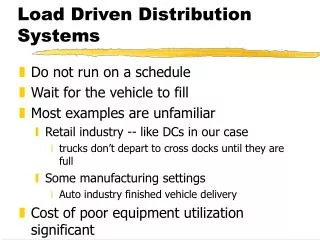
Load Driven Distribution Systems. Do not run on a schedule Wait for the vehicle to fill Most examples are unfamiliar Retail industry -- like DCs in our case trucks don’t depart to cross docks until they are full Some manufacturing settings Auto industry finished vehicle delivery

Load Driven Distribution Systems
E N D
Presentation Transcript
Load Driven Distribution Systems • Do not run on a schedule • Wait for the vehicle to fill • Most examples are unfamiliar • Retail industry -- like DCs in our case • trucks don’t depart to cross docks until they are full • Some manufacturing settings • Auto industry finished vehicle delivery • Cost of poor equipment utilization significant
Objectives • Use Cross Docks to consolidate • What effect does this have on inventory • What effect does this have on time to delivery • This pass, we will focus on inventory • Later, in the guise of “trailer fill” we will look at service or time to market.
Use an Example • Ford’s new vehicle delivery • Motivation • Successful example • Regular loads - 15 vehicles per railcar
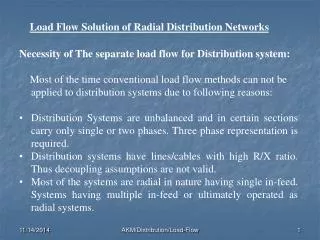
Inventory and Ford’s New Car Distribution • Ramps in the West • Laurel • Orillia • Portland • Benicia • Mira Loma • El Mirage • Belen • Denver... • Plants in the East • Norfolk • Atlanta • Louisville • St. Louis • Kansas City
12 Days Enroute • 4.3 million vehicles in North America in ‘98 • Estimates • 2 million to western ramps • $20,000 per vehicle • Average car spends 12 days in pipeline inventory or 12/365 = .033 yrs • On average about 66,000 vehicles in pipeline • Value of pipeline inventory: $1.32 billion
Other Costs • Customer service • Tracking shipment • Managing shipments • Bills of lading • Shipping invoices • …. • Real estate at the plant
Inventory at the Plant • Load driven system • When there’s a load, send it. • Each plant keeps inventory for each ramp • Average number of vehicles per load lane? • With 16 ramps • Average number of vehicles per plant? • We could be doing other things with that land...
Observation • Inventory in a load-driven distribution system depends on • The capacity of the transportation units and • ...
The Old Model % b % b % b % b %
The New Model % b % g b % b % Mixing Center b % Plants Ramps
Advantages • At the plant • Average inventory of west bound vehicles? • Space required • Between the plant and the mixing center • Larger volume of shipments supports faster unit trains -- no stopping at switching yards • Between the mixing center and the ramp • Larger ramps also support unit trains • To the customer: Faster delivery!
Disadvantages • Additional handling at the mixing center • Every vehicle unloaded from one railcar and loaded onto another • Additional opportunity to damage vehicle • Additional capital investment • Vehicles move farther • but generally faster
Inventory at the Mixing Center? • Minimum Inventory Strategy • Rail cars come in with mixed loads • Empty the rail cars into load lanes • Re-load full load lanes • Bring in empty rail cars if necessary • How much inventory? • At most • 16 ramps*(14 cars per lane) = 224 vehicles • On average • 16 ramps*(7 cars per lane) = 112 vehicles
Inventory at the Mixing Center? • Simple Strategy • Rail cars come in with mixed loads • Empty the rail cars into load lanes • Re-load full load lanes • Only if empty rail car is available • How much inventory? • Claim: 210 vehicles!
Inventory under the Simple Strategy • Mixing center has 210 vehicles • [210 = (16-1)*(15-1)] • A rail car arrives with 15 more vehicles • That makes 225 = 16*(15-1)+1 vehicles • We can re-load the rail car. WHY? • That leaves us with 210 vehicles again. • Can you generalize this?
Time Enroute cut to 8 days • Effect on inventory: • 12 days = $1.32 billion in inventory • 8 days = $ 880 million in inventory • Savings of $440 million can go to pay for capital and operating expenses at the mixing center. Right?
Wrong! • Reducing inventory by $440 million doesn’t create $440 million in new wealth, it just gives us the use of that money. • We don’t have to borrow $440 million. • Savings is the interest: $110 million per year.
When we look at network design... • How many mixing centers should we have? • Where should they be? • Who should use them?