Download
1 / 36
360 likes | 496 Vues
The Carbon Cycle: Global to local Ruth Varner, PhD. Atmospheric CO 2 at Mauna Loa.

E N D
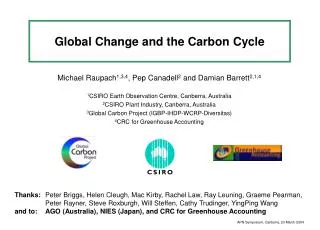
The Carbon Cycle: Global to local Ruth Varner, PhD
Atmospheric CO2 at Mauna Loa Keeling, C.D. and T.P. Whorf. 2004. Atmospheric CO2 records from sites in the SIO air sampling network. In Trends: A Compendium of Data on Global Change. Carbon Dioxide Information Analysis Center, Oak Ridge National Laboratory, U.S. Department of Energy, Oak Ridge, Tenn., U.S.A.
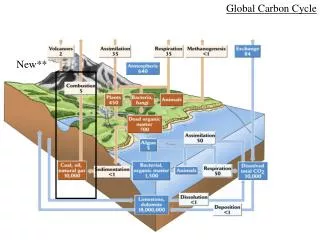
The Earth System • The Earth is a system made up of components. • There are feedbacks between these components. • These relationships can be used to predict past and future changes in the environment. • The Carbon cycle is an important Earth System.
Formation of Fossil Carbon • Coal: from the remains of plants (mainly from Carboniferous period) • Oil: from marine organisms that were buried under ocean or river sediments • Natural Gas: was originally oil; higher temperature and pressure converted it to primarily methane
Combustion Burning hydrocarbons produces CO2 and CO: CxHx + O2CO2 + H2O (if enough O2) Complete combustion Hydrocarbon + oxygen = carbon dioxide and water CxHx + O2CO2 + CO + H2O (if not enough O2) incomplete combustion Hydrocarbon + oxygen = carbon dioxide and carbon monoxide and water
Biological uptake/release of CO2 Photosynthesis – carbon fixed from inorganic CO2 to organic molecules (sugars) 6 CO2 + 6 H2O C6H12O6 + 6 O2 chlorophyll, sunlight Respiration – sugar is “burned” as part of a metabolic process that consumes oxygen and produces energy (ATP) – decomposition results in respiration C6H12O6 + 6 O2 6 CO2 + 6 H2O + energy
From the Atmosphere: Inorganic C in the Ocean CO2 (atm) ↔ CO2 (aq) ↔ HCO3- + H+ ↔ CO32- + H+↔ CaCO3 ↔ seds
Carbon dioxide in the oceans Calcareous skeleton carbon– can be dissolved or deposited
UNH/NOAA-PMEL CO2 Buoy in Gulf of Maine In overlying atmosphere In sea water
Terrestrial Carbon • Soil carbon is released through respiration : root and microbial (decomposition) • Plants respire CO2 • Plants also fix carbon through photosynthesis
Terrestrial Carbon Biological uptake/release of CO2 Photosynthesis – carbon fixed from inorganic CO2 to organic molecules (sugars) 6 CO2 + 6 H2O C6H12O6 + 6 O2 chlorophyll, sunlight Respiration – sugar is “burned” as part of a metabolic process that consumes oxygen and produces energy– decomposition results in respiration C6H12O6 + 6 O2 6 CO2 + 6 H2O + energy
FLUXNET • Global network of flux towers used to measure CO2 exchange between ecosystems and the atmosphere • Sites also include measurements on vegetation, soils, hydrology and meteorology. • Information available to researchers, students and educators.
Total ecosystem respiration =Rsoil + Rleaf + Rstem + Rcwd Rleaf Rstem Rcwd Rsoil
Rsoil = Rroot + Rdecomp Soil CO2 efflux is a measurement of the Rsoil that reaches the atmosphere
Measuring Soil CO2 Efflux Manual chamber measurements Autochamber measurements
Volcanic CO2 Subduction of limestone at plate boundaries Carbonotype: watery low temperature lava
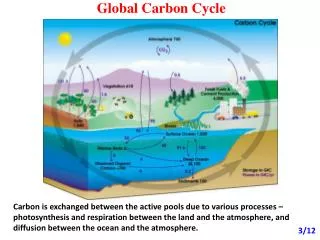
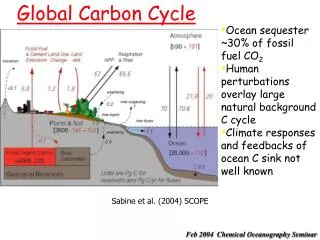
Oceans +2 Pg yr-1 Atmosphere +2 Pg yr-1
Carbon Fertilization ? FACE Duke Forest, Chapel Hill, NC
c9 c5 c6 c10 c7 c11 c8 c1 c2 c4 c3 • Temperate poor fen in southeastern New Hampshire (43 12.5’N, 71 3.5’W) • Area: 1.7 ha • Peat depth: 2-4.5m • Mean annual precipitation: 1100 mm • Mean annual temperature: 8.1 C • Mean growing season T: 14.9 C • Biologically active season from April-October • Sphagnum dominated • Other important species are leatherleaf, blueberry, sedge
Automated ChamberFluxes Control System Box Pump Select to chamber MFC IRGA LI6262 Select from chamber Clear Lexan Boxes 0.07 – 0.08 m3 (5) 0.14 – 0.16 m3 (5) Distributed Return Manifold Fans mix headspace A flux every 20 minutes 96 fluxes per day
Manual ChamberFluxes • CH4: Grab samples taken during chamber measurements; analyzed on an GC-FID • CO2: IRGA (LiCor 6200) analyzes air from chamber headspace; calculates NEE
1995 2007 Vegetation survey maps of Sallie’s Fen from 1995 and 2007.